CARTOGRAMA•
Everyday Proximity Index by census section in Bogotá

Everyday Proximity Index · Bogotá, Medellín, Cali and Barranquilla

How close is everyday life on foot?

We measured Colombia’s four most populous cities with the same yardstick: for every person counted by the census, how far away, walking along the street network, are food, school, public health, recreation, culture and transit, compared with everyone else in the four cities.

01 · How it is measured

The distance to everyday life, person by person.

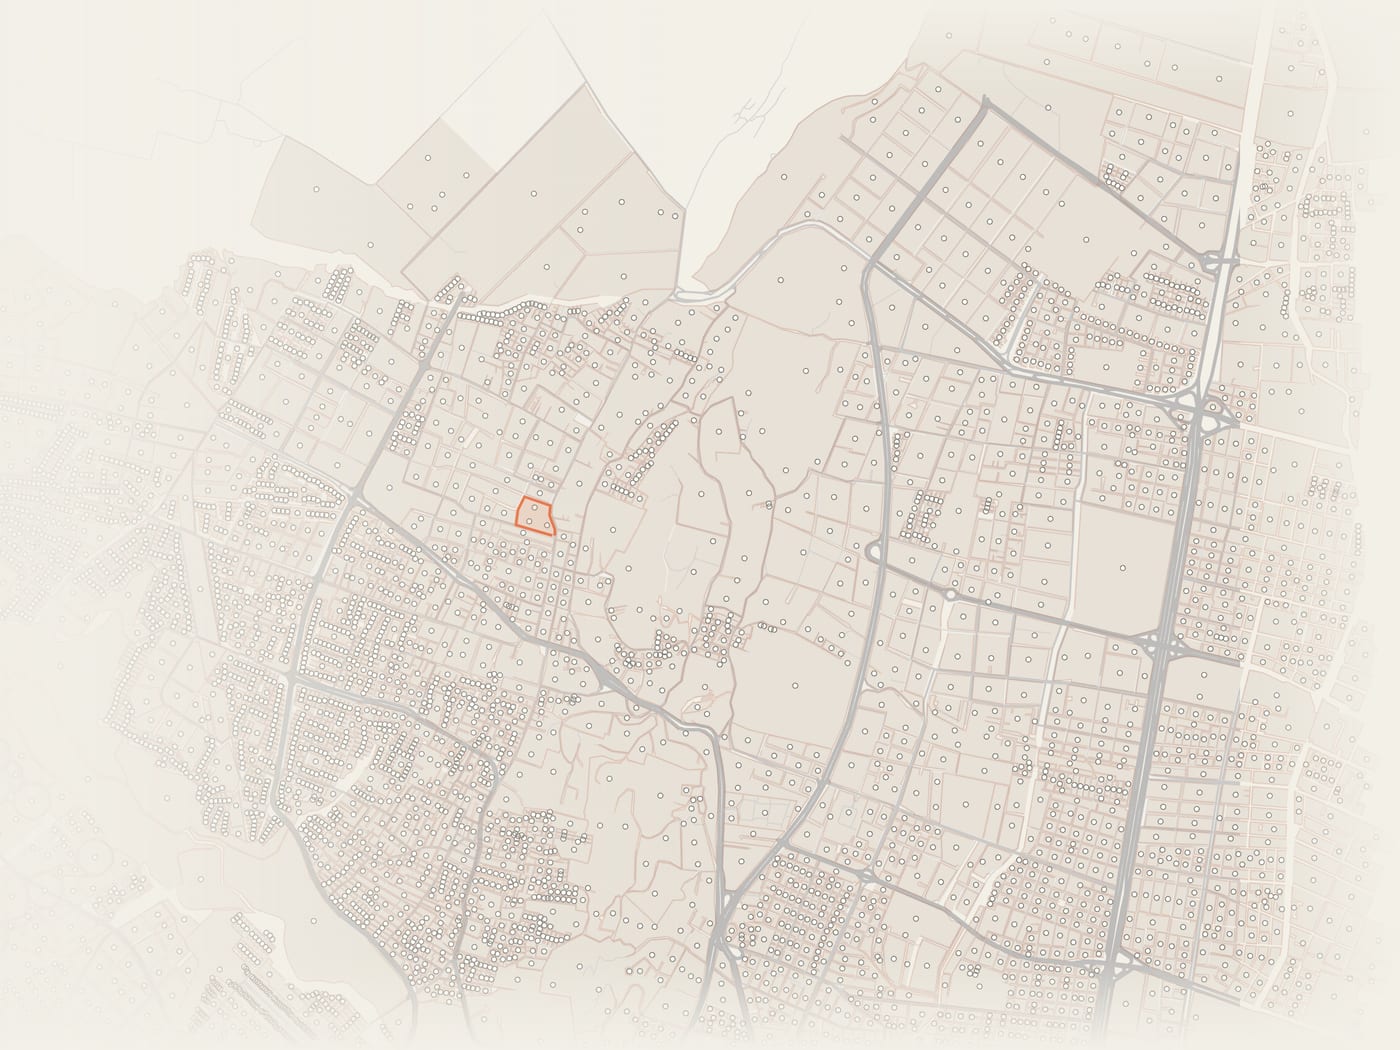
From the point of each census block, the network of streets and paths is traveled to the nearest place of each function. The example is a section of Bosques de San Jorge, in Suba: it is the same calculation as the demonstration on the home page, repeated across the 71,400 inhabited city blocks of the four cities.

One point for each city block in Bogotá
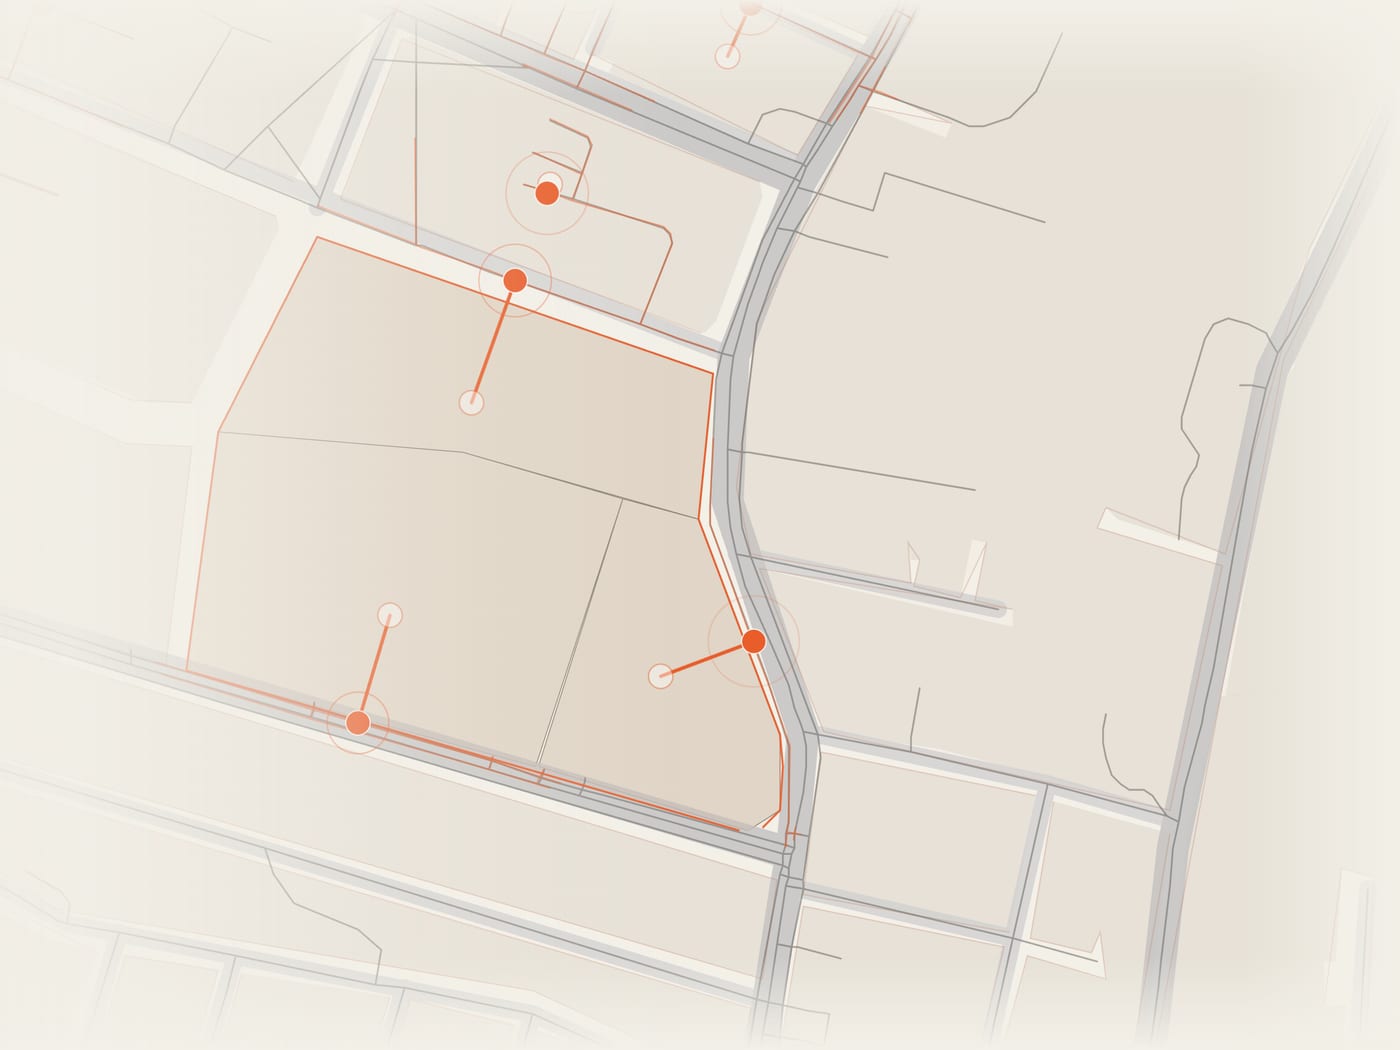
01 Each city block in the 2018 census has a point inside it carrying the people who live there: 43,331 in Bogotá. The box is the example section.
Each point connects to the nearest walkable network
02 Each point is joined to the nearest street or path. The connector counts toward the distance and cannot exceed 150 m.
Walking route along the street network
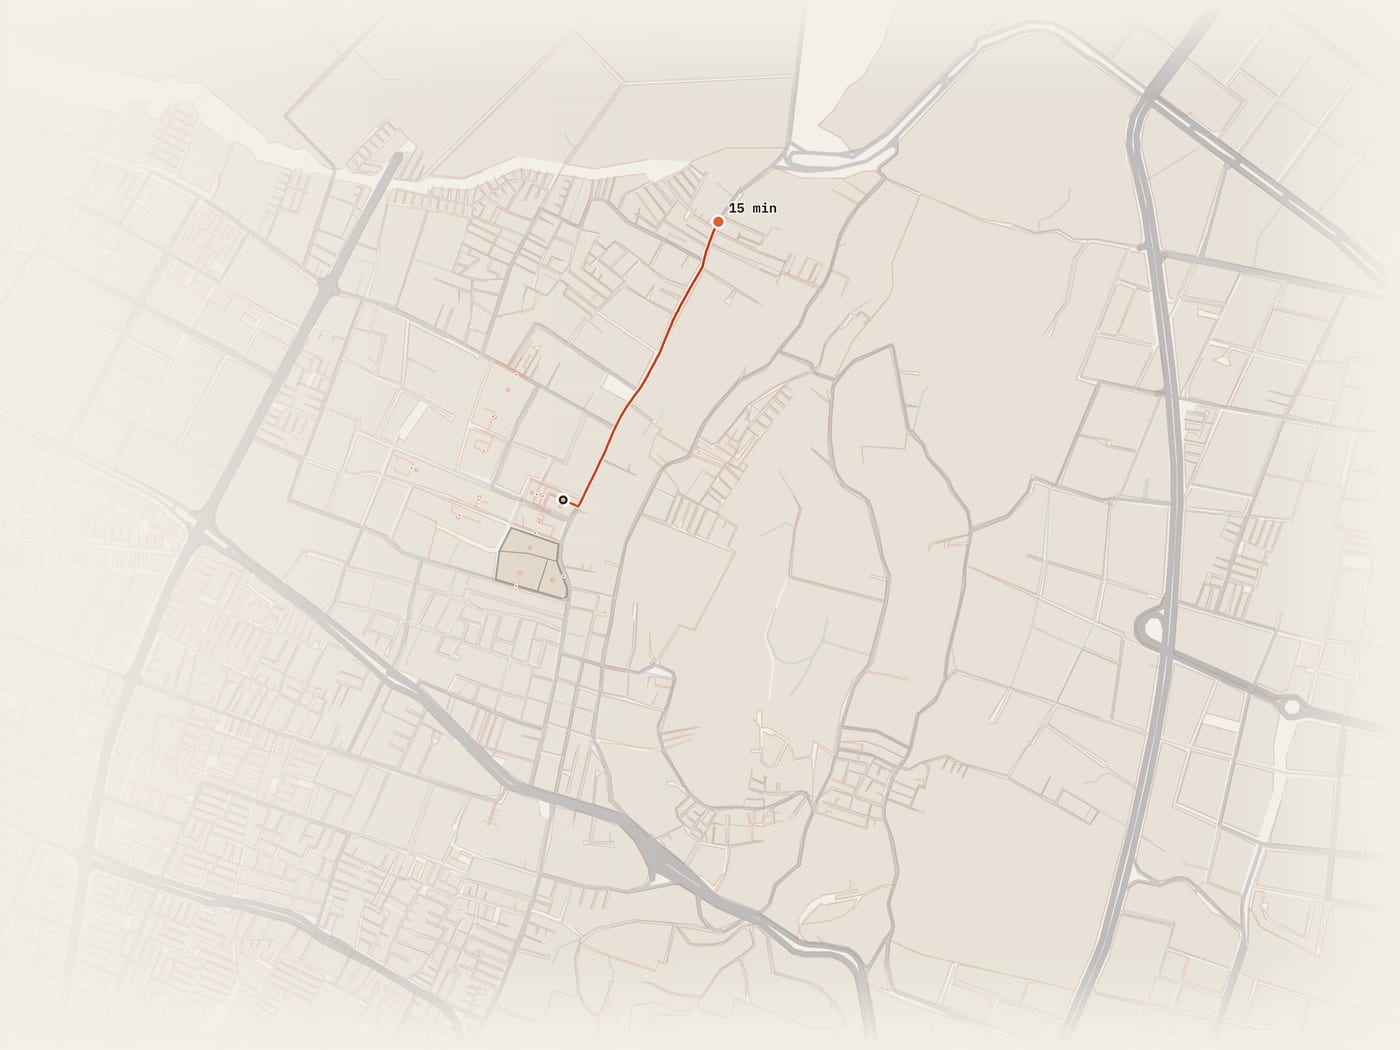
03 The route follows the streets, not a straight line: fifteen minutes at 4.8 km/h are 1,200 m along the network.
Area reachable on foot and the places it holds
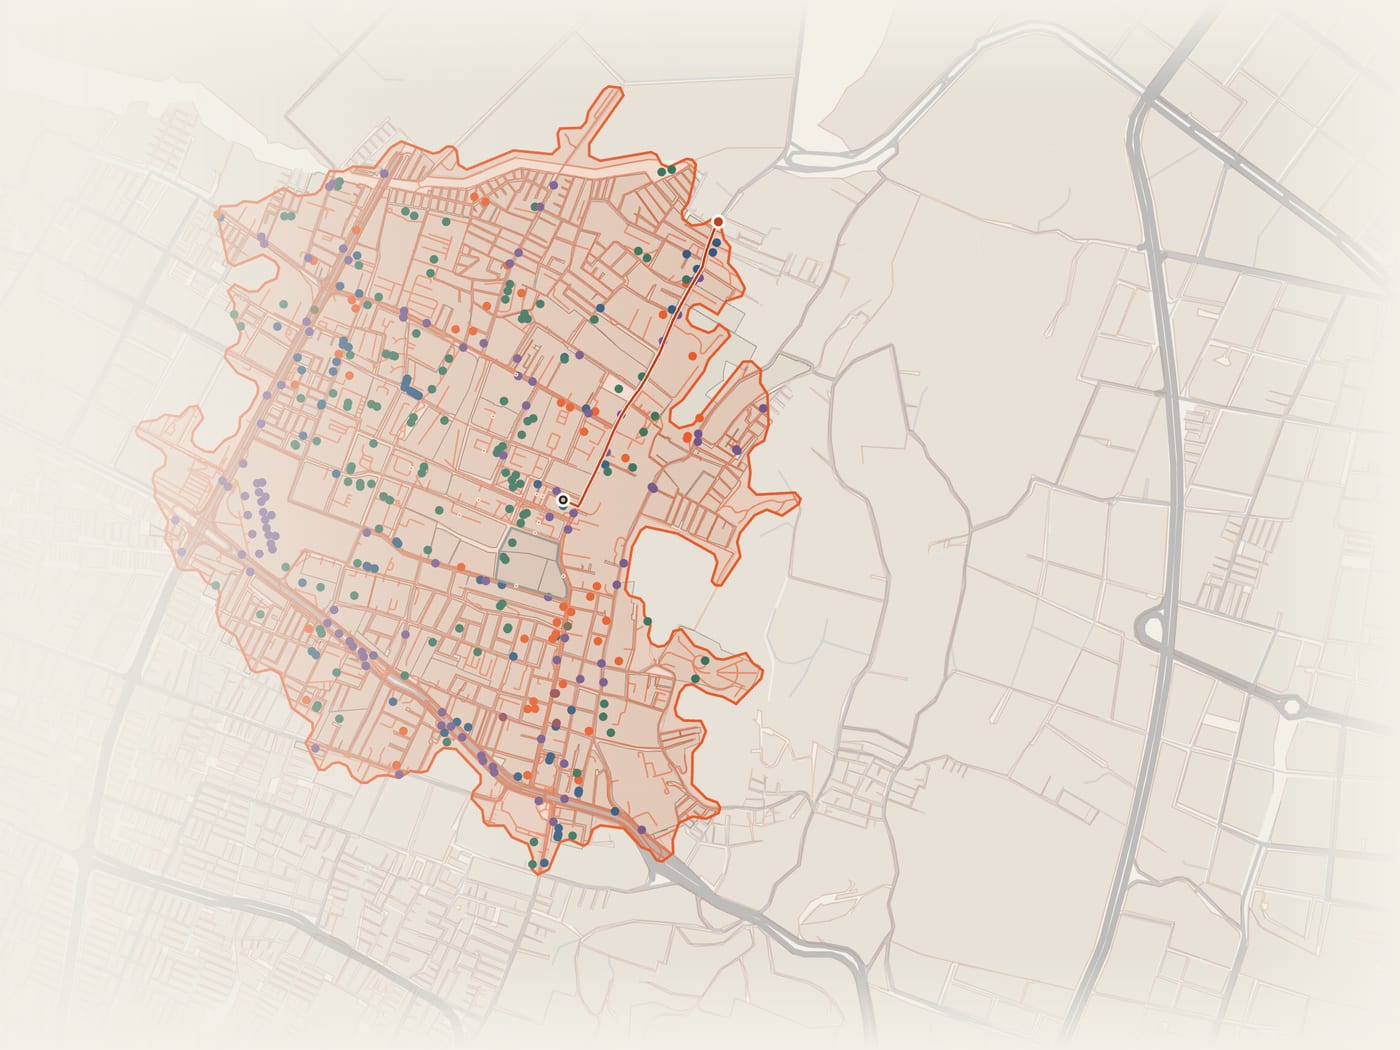
04 For each function, the distance to the nearest place is kept: food and recreation from OpenStreetMap; schools from DANE; public health from REPS; culture from the Ministry and district inventories; transit stops from GTFS and official sources.

See the full demonstration on the home page →

02 · A single scale

One scale for all four cities.

The index runs from 0 to 100 and compares each person with the 12.3 million people of the four cities: an index of 30 means that person lives farther from everyday life than 70% of them; one of 80, closer than 80%. It is calculated for each of the six functions and averaged. A city’s index is the average of the people who live in it.

Each bar shows how the people of each city are distributed among five groups of equal size across the four cities combined: from the 20% with the least proximity (dark red) to the 20% with the most (cream). If a city resembled the whole, each color would take up a fifth. Click a city to open it in the atlas.

How to read the chart

03 · People and proximity

Where many people live far from everything, and where there is city to spare nearby.

Each census section has a density, how many people live per hectare of city block, and a proximity index. Crossing the two reveals two situations that call for opposite responses. The thresholds are calculated over the sections of the four cities, weighted by population:

Where many people live with little proximity, services are needed: health, schools, culture and transit where people already live. Where there is high proximity and few people, the city can take in more residents without moving them away from everyday life.

In each city

The four cities, on the map

↑ more people per hectare · → higher proximity index. Red: many people, little proximity. Green: high proximity, few people.

04 · What is missing

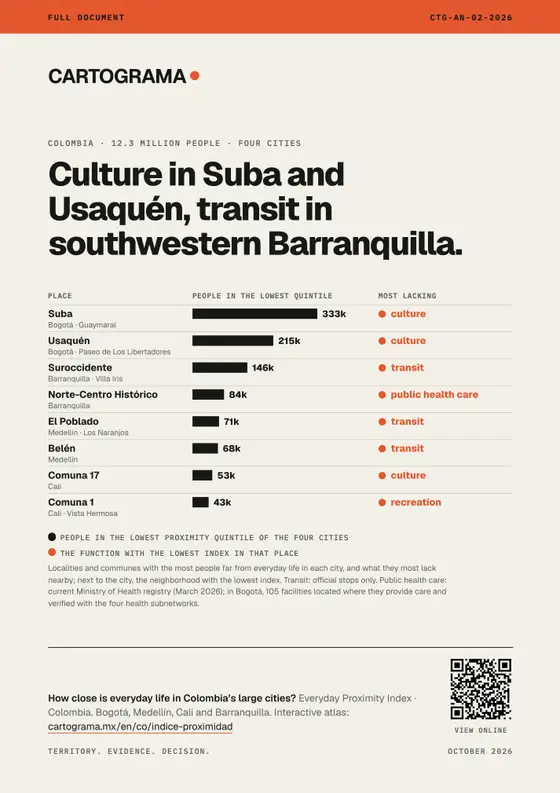
What is missing close to home changes from one city to another.

The index sums up six functions, but they are not all missing equally. The table shows each city’s score for each function, from 0 to 100, with the same color scale for the whole table.

People without the service within a fifteen-minute walk

The index compares positions; these bars count absences: the share of each city’s population that has not a single place of that function within 1,200 m along the network.

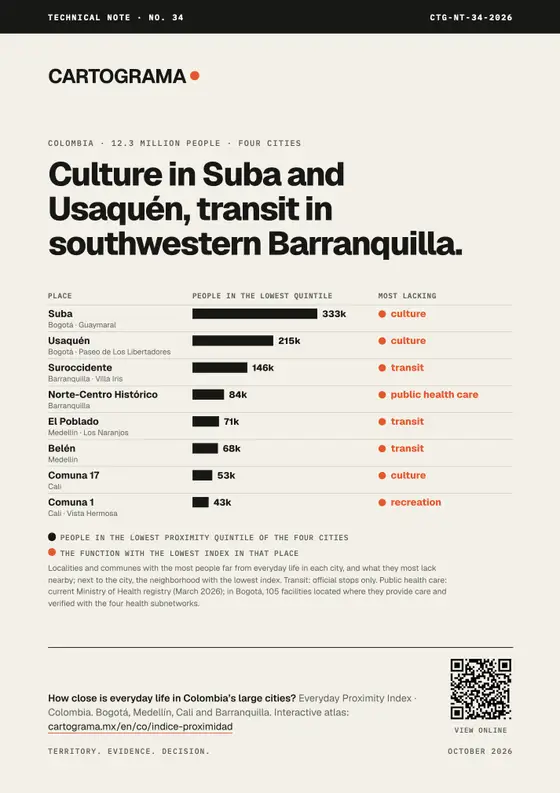
Public health facilities. Current Ministry of Health register (March 2026 cutoff); in Bogotá, 105 facilities placed at the address where they provide care and checked against the four public health subnetworks.

05 · Interactive atlas

Explore every census section of the four cities.

Choose a city and a function, or the crossing of people and proximity. On hover, each section shows its population, its index and the distance to the nearest place of each function. In Bogotá, new construction, height and pedestrian crashes are added.

Open in a new tab

06 · The four cities

Each city, by the same rule.

Choose one to open it in the atlas.

07 · Bogotá in depth

The city grows where everyday life is far away.

We crossed the index with Bogotá’s cadastre and road crash records (Datos Abiertos Bogotá and IDECA). Each census section is placed in its proximity quintile of the four cities; the table compares the five groups.

Sources: change in built area by cadastral block, ten annual periods from 2016 to 2026; average height by block in 2026 (the series changes method in 2023, so years are not compared); road crashes from 2015 to 2021. Pedestrian crashes are counted per resident: in the center, people who live elsewhere also walk.

08 · What we found

What is most missing close to home is what the public sector builds.

    Use the index to order investment: bring public health, culture and transit to where the 20% of people with the least proximity live, and steer new housing toward the sections with high proximity and few people.

    09 · Validation

    Where each city block is placed and where the destinations come from.

    The calculation can be reproduced

    Repeating the calculation from the source data, all 66,303 city blocks of Bogotá, Medellín and Barranquilla give the same distances and statuses. City blocks and destinations are connected only to each city’s main pedestrian network, so that internal roads of complexes with no exit to the street do not leave blocks isolated.

    Each city block’s point falls on the network

    Distance from each city block’s point to the nearest street or path, by share of people. City blocks more than 150 m away are not included in the index.

    Official destinations by city

    How solid the ranking is

    The main version (F) uses official inventories where they exist. With OpenStreetMap only (A), Bogotá moves to first place. Cali’s census blocks add up to 81.5% of the 2018 DANE urban population; the index does not distribute the difference.

    10 · Data

    The documents and tables behind the index.

    For your city

    We run this analysis for your city, with your data and your question.

    The same method works in any municipality in Colombia with open data, and it is refined with each government’s own records.

    Discuss a project →