Everyday Proximity Index · Madrid, Barcelona, València, Zaragoza, Sevilla and Málaga
How far away is everyday life on foot in Spain’s large cities?
We measured the six Spanish cities with more than 500,000 inhabitants by the same yardstick: for each registered resident, how far away food, education, health, recreation, culture and transit are, walking along the street network, compared with everyone else in the six cities.
01 · How it is measured
The distance to everyday life, person by person.
From the point of each populated census section, the network of streets and paths is followed to the nearest place of six functions: food, education, health, recreation, culture and transit. Fifteen minutes on foot, at 4.8 km/h, is 1,200 m along the network. In Spain the unit is the INE census section, with the population from the 2025 Annual Census; the destinations of the six functions come from OpenStreetMap. 17 populated census sections (27,185 people) have no index: their point could not be connected to the pedestrian network within 150 m.
For each function, each person receives the position they hold relative to everyone else: an index of 30 means they live farther from that function than 70% of the people measured; one of 80, closer than 80%. The index is the average of the six functions, and a city’s index is the average of the people who live in it.
02 · One scale
03 · People and proximity
Where many people live far from everything, and where there is city to spare nearby.
Each census section has a density, how many people live per hectare, and a proximity index. Crossing the two reveals two situations that call for opposite responses:
Where many people live with little proximity, services are needed. Where there is high proximity and few people, the city can take in more residents without moving them away from everyday life.
04 · What is missing
The index summarizes six functions, but they are not all equally missing. The table shows the score of each function, from 0 to 100, with the same color scale for the whole table; below each score, the median distance per person.
People without the service within a fifteen-minute walk
The index compares positions; these bars count absences: the share of the population without a single place of that function within 1,200 m along the network.
05 · The six cities
The six cities, on the same scale.
Each city, with the same rule and the same color scale. Tap one to open it on the map.
06 · Interactive atlas
Explore each census section on the map.
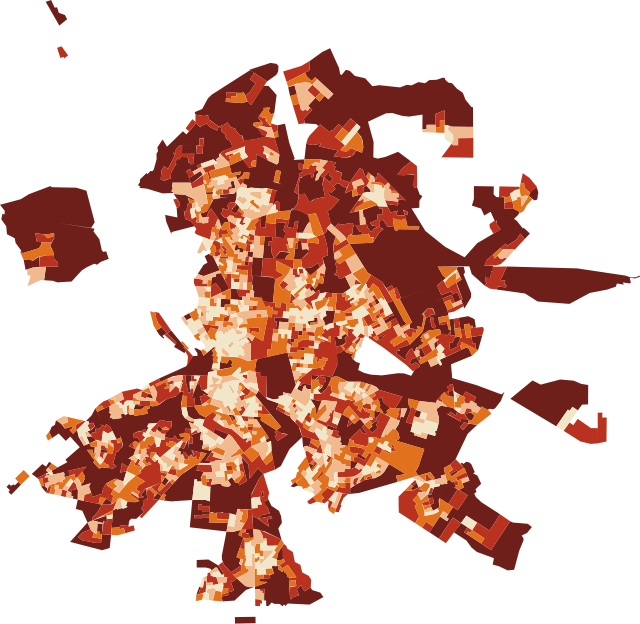
Choose a function or the cross of people and proximity. On hover, each census section shows its population, its index and the distance to the nearest place of each function.
Measure your neighborhood: find your street and compare it →
For your city
We carry out this analysis for your city, with your data and your question.
The same method works in any city with open data, and it is refined with each government’s own records.
Discuss a project →