Pedestrian network analysis
The walled city
How far people really walk to the primary school, day care, corner shop or clinic in Cancún, measured on the OpenStreetMap street network, and what changes for those who live behind a gate.
In one sentenceEvaluates the real effect of gated estates: they distance those inside more than those outside.
Spanish original: La ciudad amurallada
How far is what is close?
On the map the school is three blocks away. On foot you have to go around the superblock, find the U-turn or leave through the estate's only gate.
This atlas measures the distance actually walked and what changes for those who live in gated estates.
Key findings
The street is never straight
The median resident walks 1.63 times the straight-line distance to the nearest primary school; the worst-off 10%, 2.6 times or more.
90,000 people behind a gate
9.9% of the population lives in blocks whose nearest street is private. Inside, the primary school is 1,355 m away on foot (outside, 572 m) and 68% walk more than 1 km.
The effect falls on those inside
The detour is similar inside and outside; the difference lies in the scarcity of services inside. For those outside, closing private streets lengthens the walk to school for 0.6% of the population.
Approach
Step 1
Build a 4,069 km pedestrian graph from OpenStreetMap, separating private streets and gates closed to pedestrians.
Step 2
Measure, for every block, the network and straight-line distance to the nearest service with multi-source Dijkstra.
Step 3
Compare the full network with the public network to separate the effect of the layout from the effect of closure.
How to read it
- OpenStreetMap may miss footpaths, pedestrian gates or access tags: the population behind a gate is an estimate.
- Sidewalks, safe crossings and gate opening hours are not modelled.
- The effect of closure is measured on the trip to the nearest service, not on longer trips across an estate.
Data
OpenStreetMap
Walkable ways, access tags and barriers (gates and booms), September 2026.
Business directory 2026
Primary schools, preschools, day care, corner shops and primary health care.
2020 Census
Population by block.
What supports the method
- Jennifer Dill · Portland State (2003)The detour index corresponds to Pedestrian Route Directness; Portland accepts 1.5 as a maximum and short-block grids give 1.4–1.5 (p. 5). In Cancún the median to the primary school is 1.63.
- Raford y Ragland · UC Berkeley SafeTREC (2004)Space-syntax integration predicts pedestrian flows (p. 6).
Paraphrased; page numbers refer to the PDF consulted. The library is in Spanish.
What you just saw
Network walking distances and a detour index, with and without gates and private streets.
What else this method can answer
- Which pedestrian accesses should open first?
- Which new developments would lack services on foot?
- Where should a school or clinic go?
In other places
Replicable with OpenStreetMap and service locations.
Line of work
B · Accessibility, proximity and care →Do you have a similar question in your city?
Describe the problem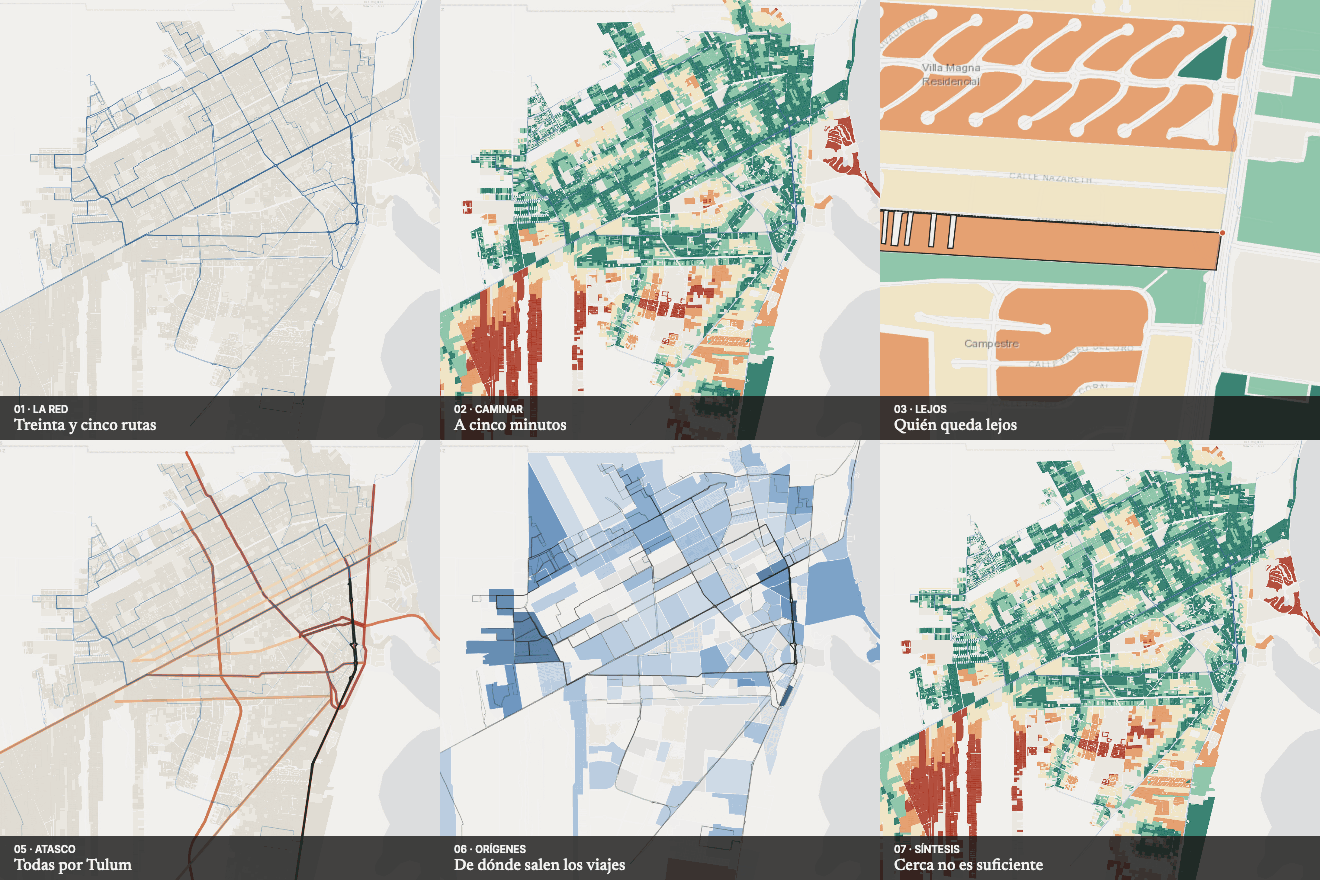 Next in Accessibility and mobilityHow far is the bus?