Consulting · Line B
Accessibility, proximity and care
Who reaches what, in how long, and who is left out?
Coverage is usually measured with straight-line radii. People walk along streets, wait for the bus and chain care trips. Measuring real accessibility changes where a facility, a route or a crossing is needed.
Questions it answers
- How many jobs can each neighbourhood reach in 30, 45 or 60 minutes?
- How far do people really walk to school or the clinic?
- Who has a single transit route, or none?
- How much city does someone lose by stopping at day care before work?
- Where are care services missing within walking distance?
How it is done
- Build the networkOpenStreetMap pedestrian network and transit routes, with explicit speed and waiting assumptions.
- Compute timesIsochrones and network paths from every block or cell.
- Count opportunitiesJobs, schools and services reachable at each threshold.
- Read inequalityCompare zones, groups and scenarios such as peak hour or care trips.
Data
- OpenStreetMap
- Transit route alignments
- Business directory (DENUE)
- Population and housing census
- Traffic speeds
It works with open sources; the client's route, stop or frequency data improve precision.
Possible deliverables
- Accessibility maps by threshold
- Indicators by zone
- Compared scenarios
- Isochrone tool
- Interactive atlas
Usually useful for
- Planning and mobility departments
- International and development organisations
- Transport operators
- Care and social development programmes
Projects that back it
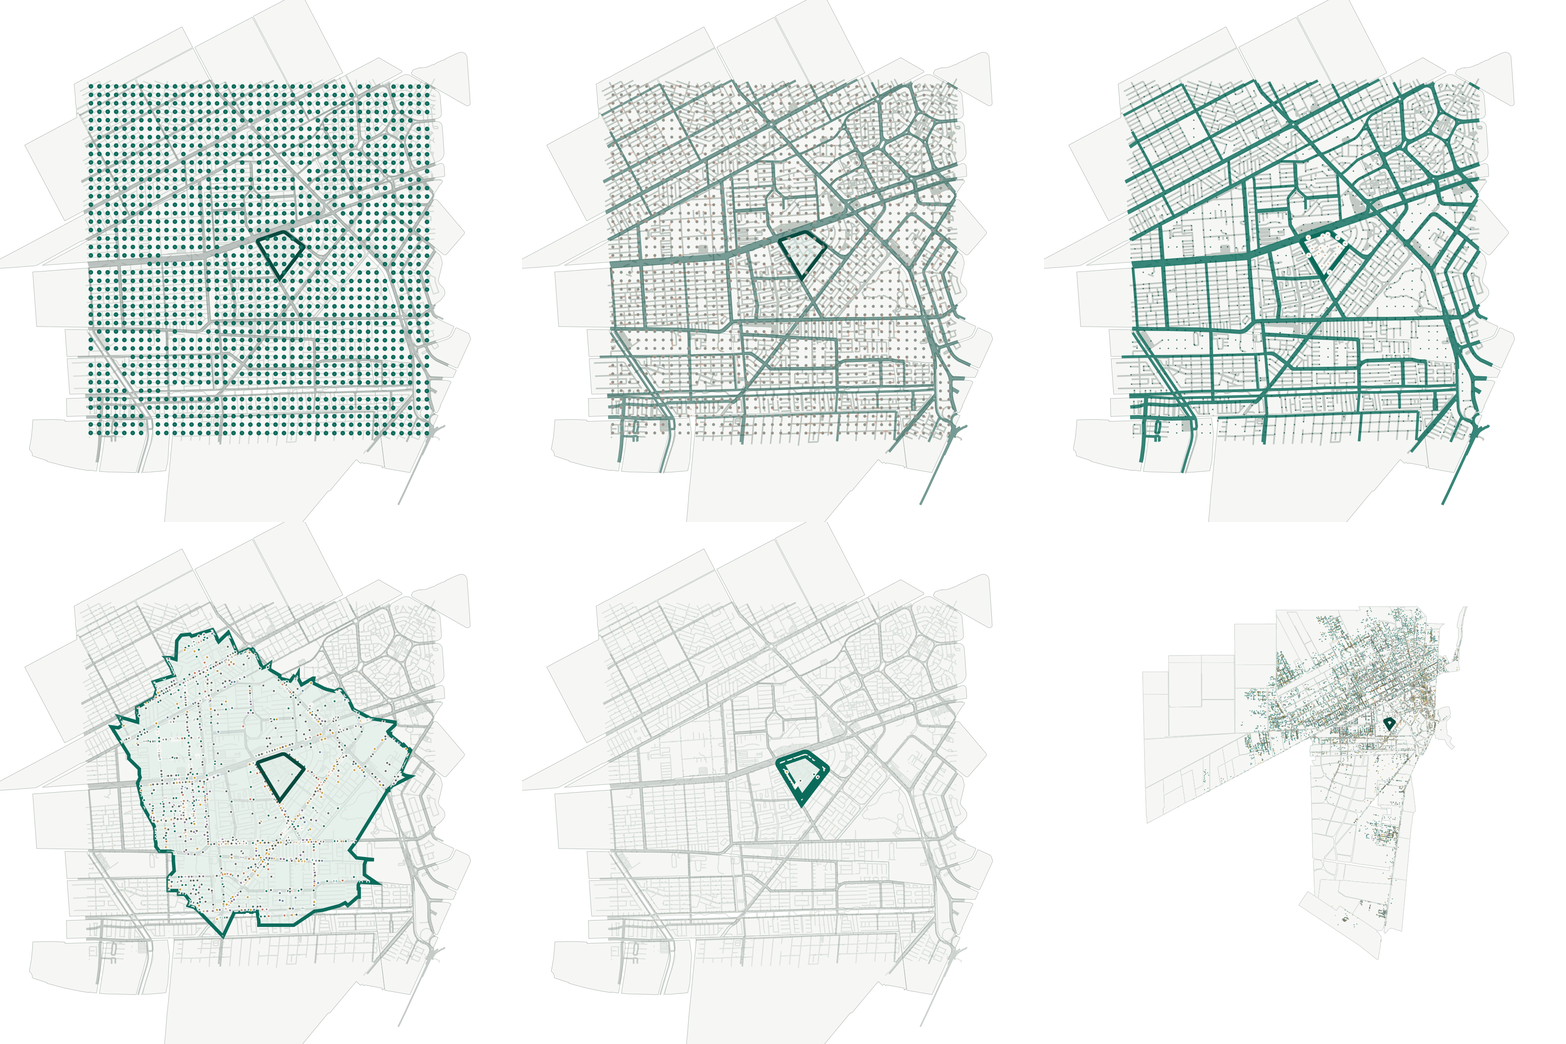 The 15-minute cityIdentifies which superblocks lack everyday functions within walking distance, and which one is missing, to guide facilities, land use and mobility.
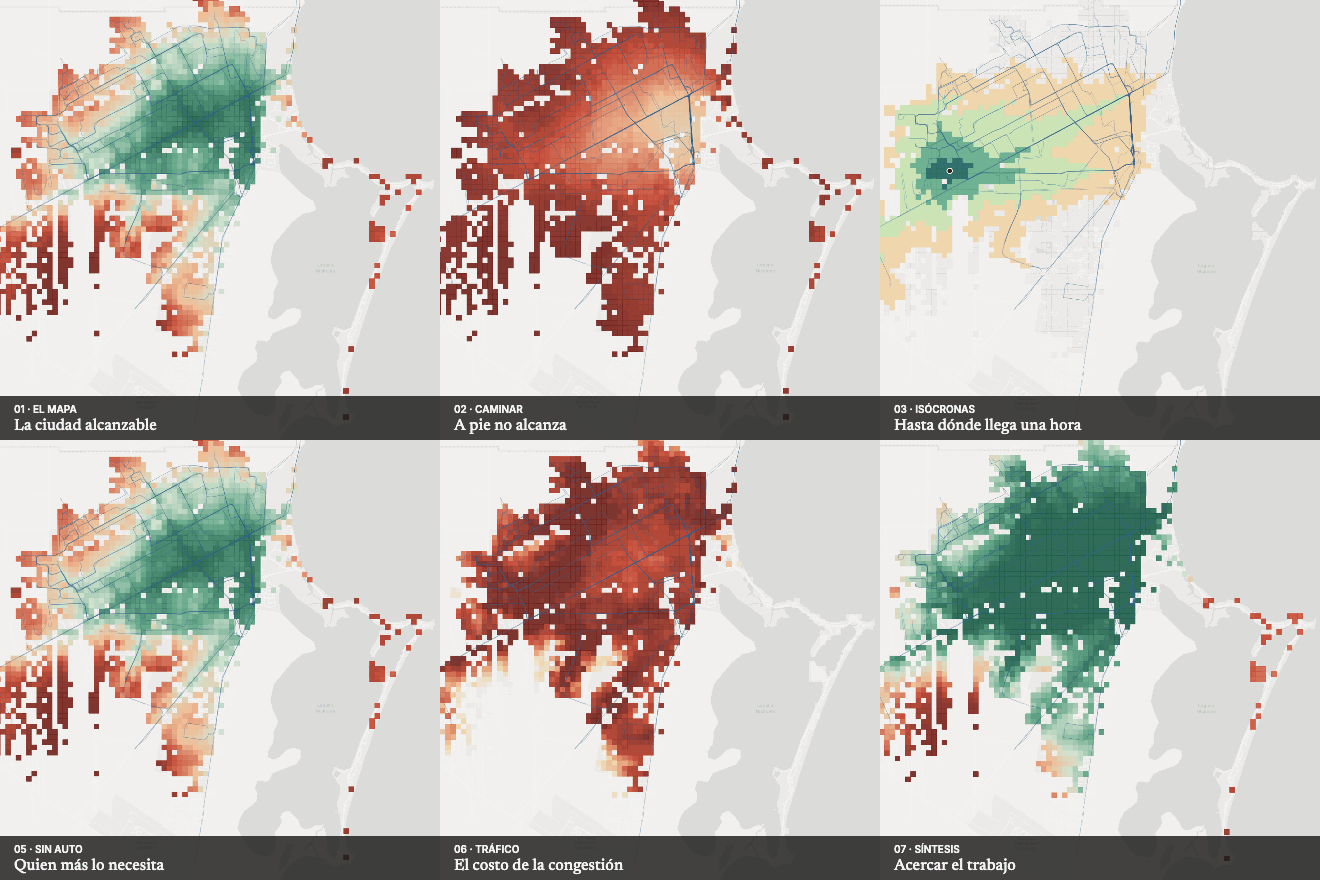 One hour by busLocates where lack of access to jobs is most severe and measures the cost of congestion: the median resident reaches 31% of jobs in 45 minutes.
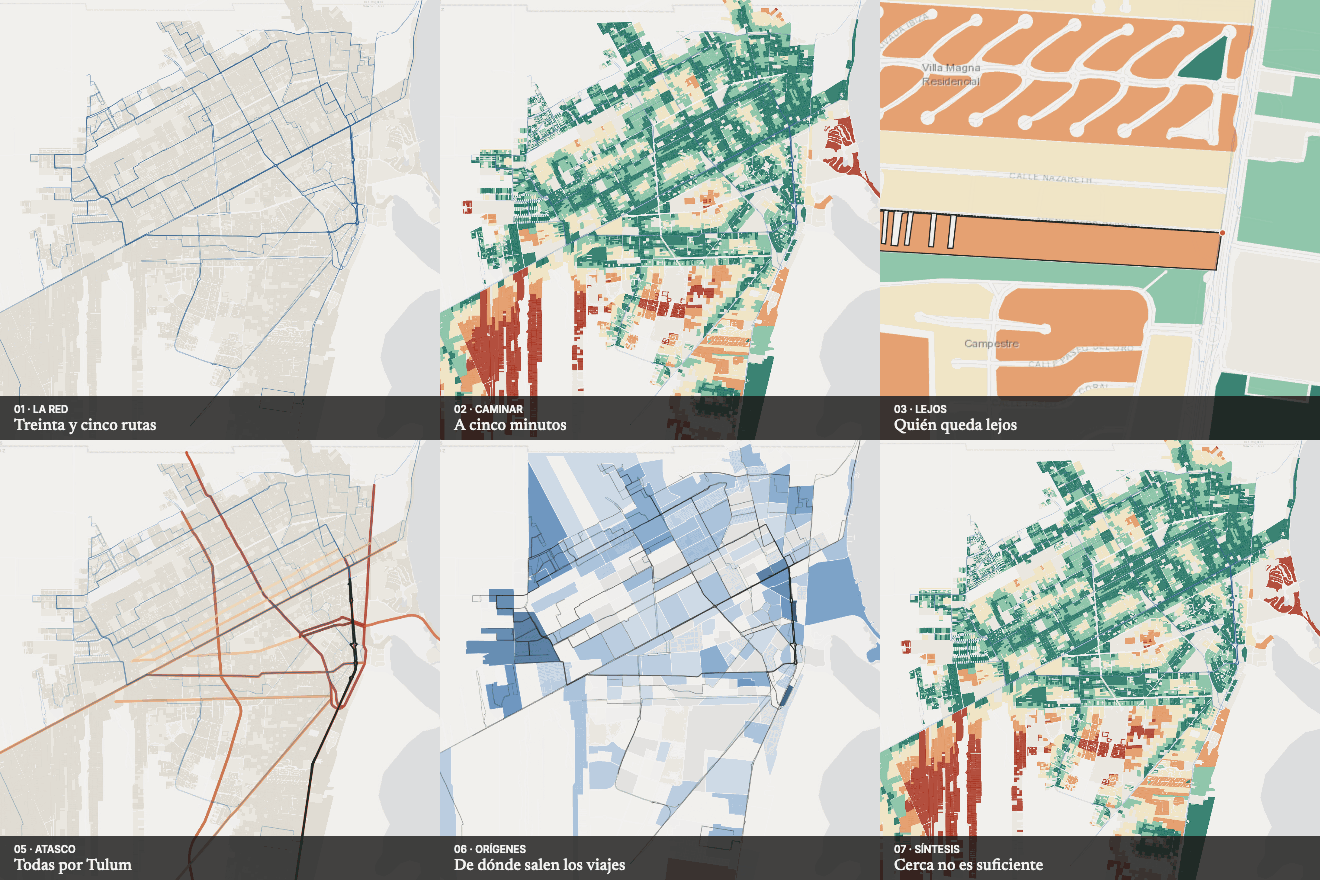 How far is the bus?Shows who depends on a single route, or none, and which routes carry congested avenues.
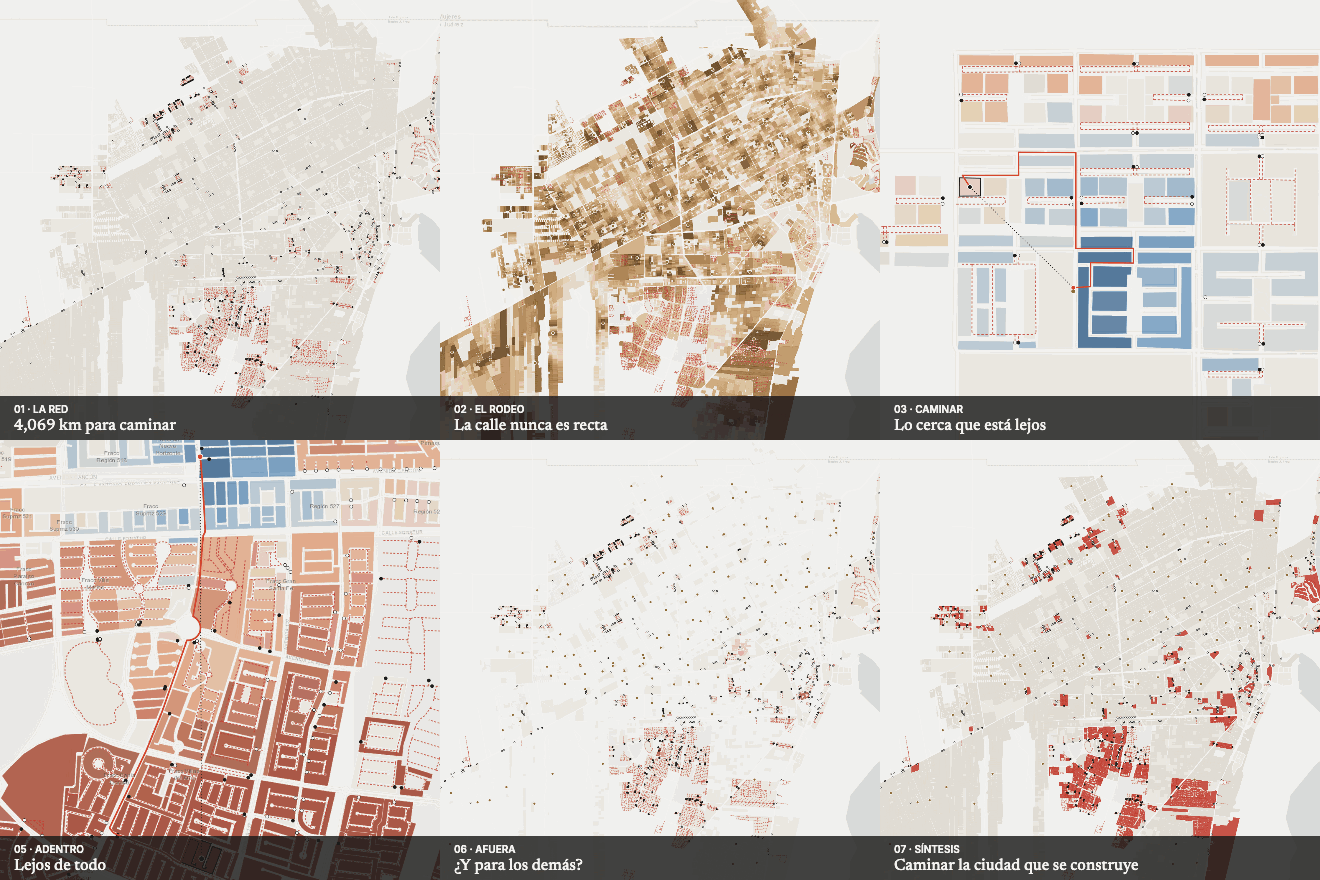 The walled cityEvaluates the real effect of gated estates: they distance those inside more than those outside.
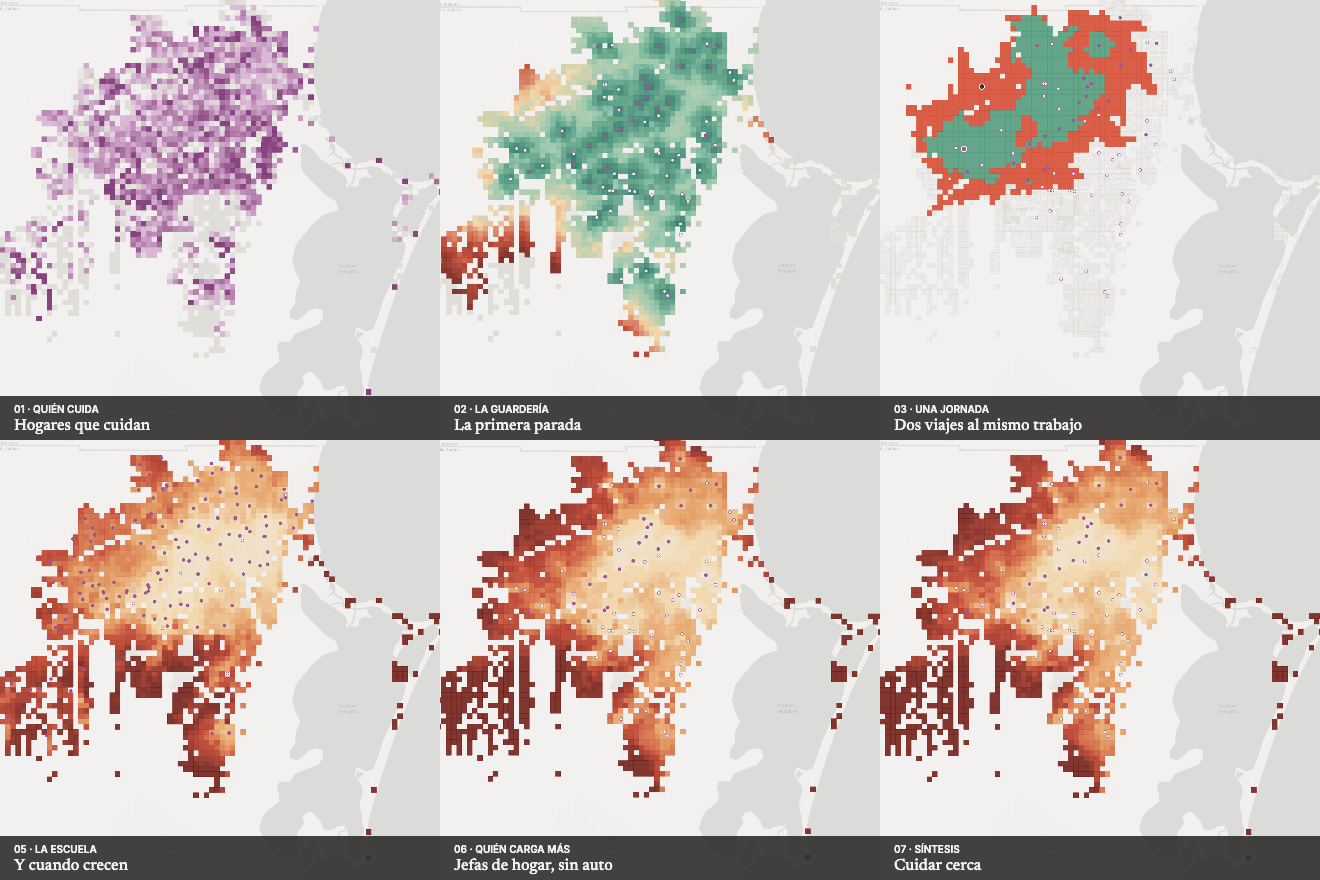 The care commuteMeasures the cost of caring in terms of reachable city: a stop at day care removes a large share of accessible jobs.
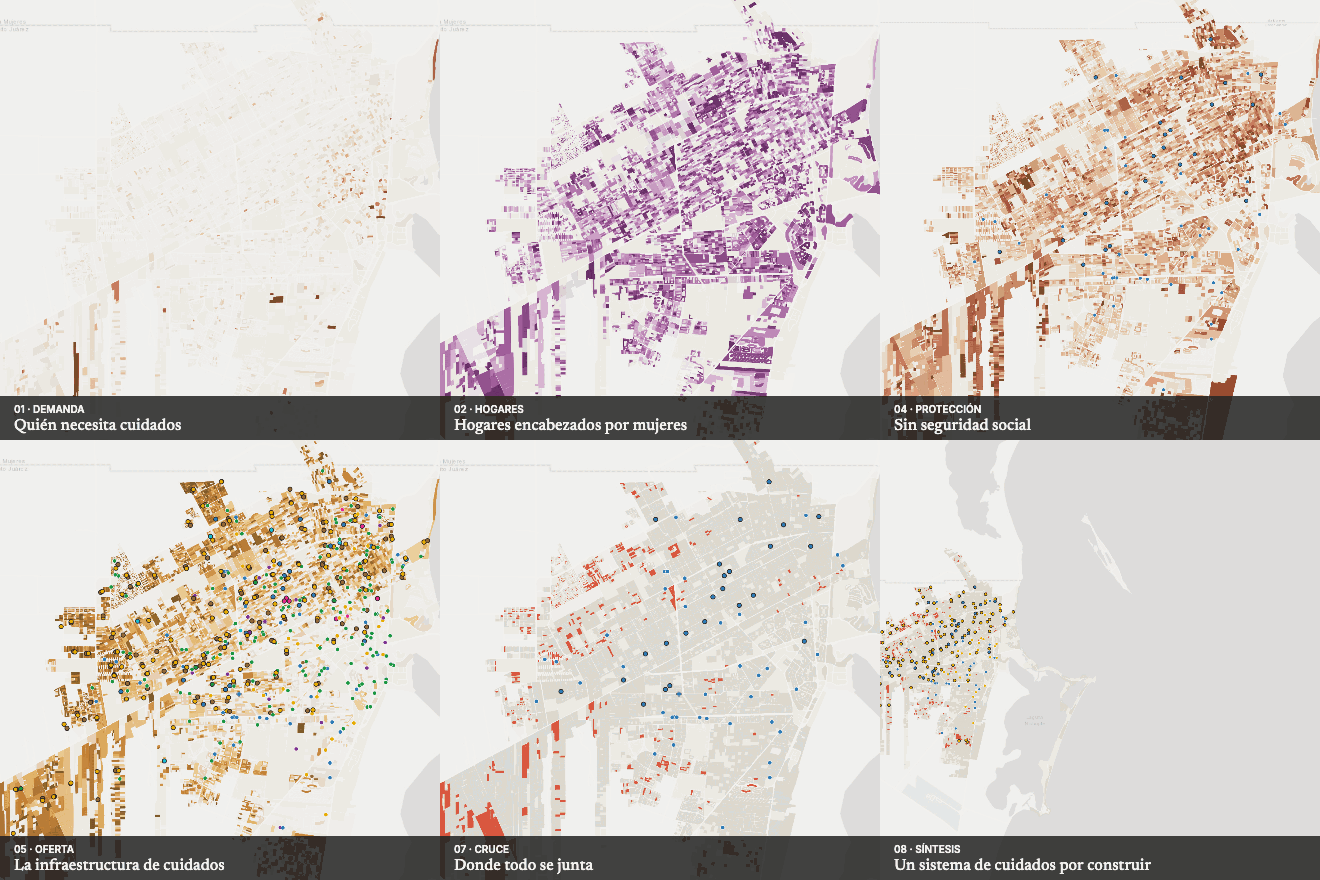 Who cares for whom?Locates the blocks where high care demand and distant services coincide.
Reference reading
From the library, which is organised in Spanish; titles appear in their original language.
- Transport and equity in Latin America: a critical review of socially oriented accessibility assessmentsGiovanni Vecchio · 2020
- Does Accessibility Require Density or Speed?Levine, Grengs, Shen y Shen · 2012
- Measuring network connectivity for bicycling and walkingJennifer Dill · Portland State · 2003
- Space Syntax: An Innovative Pedestrian Volume Modeling Tool for Pedestrian SafetyRaford y Ragland · UC Berkeley SafeTREC · 2004
- Integrating Walking and Public TransportWalk21 / UITP · 2024
- Evaluating Transport EquityTodd Litman · VTPI · 2022
- Measuring Mobilities of Care, a Challenge for Transport AgendasInés Sánchez de Madariaga · 2013
- Movilidad del cuidado: metodología para medir los viajes de cuidadoSánchez de Madariaga · Mitma
- ¿Quién cuida en la ciudad? Aportes para políticas urbanas de igualdadCEPAL · 2017
- Why Does She Move? A Study of Women's Mobility in Latin American CitiesBanco Mundial · 2020
- La caminata como modo de transporte para las mujeres en 11 ciudades de América LatinaCAF · 2018
- Pedestrians First: herramientas para una ciudad caminableITDP · 2018
Measure a territory's accessibility
Tell us what you want to decide. The request arrives with this line already selected.
Propose a project