Urban corridor and road safety
The city arrived before the street
An atlas of the Huayacán Avenue corridor, read alongside its mobility planning: how southern Cancún grew, who lives by the avenue, where crashes concentrate and what zoning is coming, kilometre by kilometre.
In one sentenceLinks evidence of growth, exposure and crashes to each segment of the corridor.
Spanish original: La ciudad llegó antes que la calle
What happens when a city grows faster than its street?
In ten years southern Cancún filled with housing estates, schools and shopping plazas, while Huayacán Avenue remained a through road. The result is a corridor where metropolitan trips, school trips, commerce and pedestrians share infrastructure designed for cars.
This atlas measures, kilometre by kilometre, where growth and the street come into conflict.
Key findings
Population doubled
Within 800 m of the axis, population rose from 11,480 to 23,665 between 2010 and 2020 (+106%); 47% live in blocks that did not exist in 2010.
Few segments, many crashes
Five 250 m segments (10.5% of the avenue) concentrate 32% of crash alerts; the most critical adds up to 225.
A growing problem
Alerts rose from 372 in 2022 to 653 in 2025 (+76%).
Children at the hotspots
5,731 people live around the five most critical segments, 1,128 of them aged 0–14.
The avenue became a destination
On the avenue's immediate frontage, businesses went from 30 to 389 between 2010 and 2026.
Approach
Step 1
Reference all information to a single 11.9 km axis and read it in 250 m segments.
Step 2
Measure population and activity growth around the avenue, identifying new blocks.
Step 3
Locate and date 2,183 crash alerts to identify critical segments and their trend.
Step 4
Estimate exposed population and priority groups, and link the evidence to the corridor plan's stages.
How to read it
- Waze alerts are user reports: useful to locate patterns, not to count victims.
- Beyond km 6.3 the 2020 census has almost no blocks; population and activity are underestimated in the newest growth.
- Actions linked to each segment come from the corridor plan; they are not a design.
Data
Crash alerts
Waze user reports, April 2021 – March 2026, with reported severity.
2020 Population and Housing Census
Population, age groups, disability and car ownership by block.
Businesses
Business directory 2010, 2020 and 2026.
Axis and streets
Huayacán Avenue and named cross streets.
What supports the method
- Austroads (2018)Treating the whole corridor outperforms treating isolated sites (p. 14).
Paraphrased; page numbers refer to the PDF consulted. The library is in Spanish.
What you just saw
Kilometre-by-kilometre diagnosis of population, activity, crashes and zoning along the axis.
What else this method can answer
- Which segment should come first?
- How many children live next to the hotspots?
- What zoning is coming and what pressure does it add?
In other places
Replicable on any avenue with its axis, census and crash records.
Line of work
C · Road safety: prioritising corridors and crossings →Do you have a similar question in your city?
Describe the problem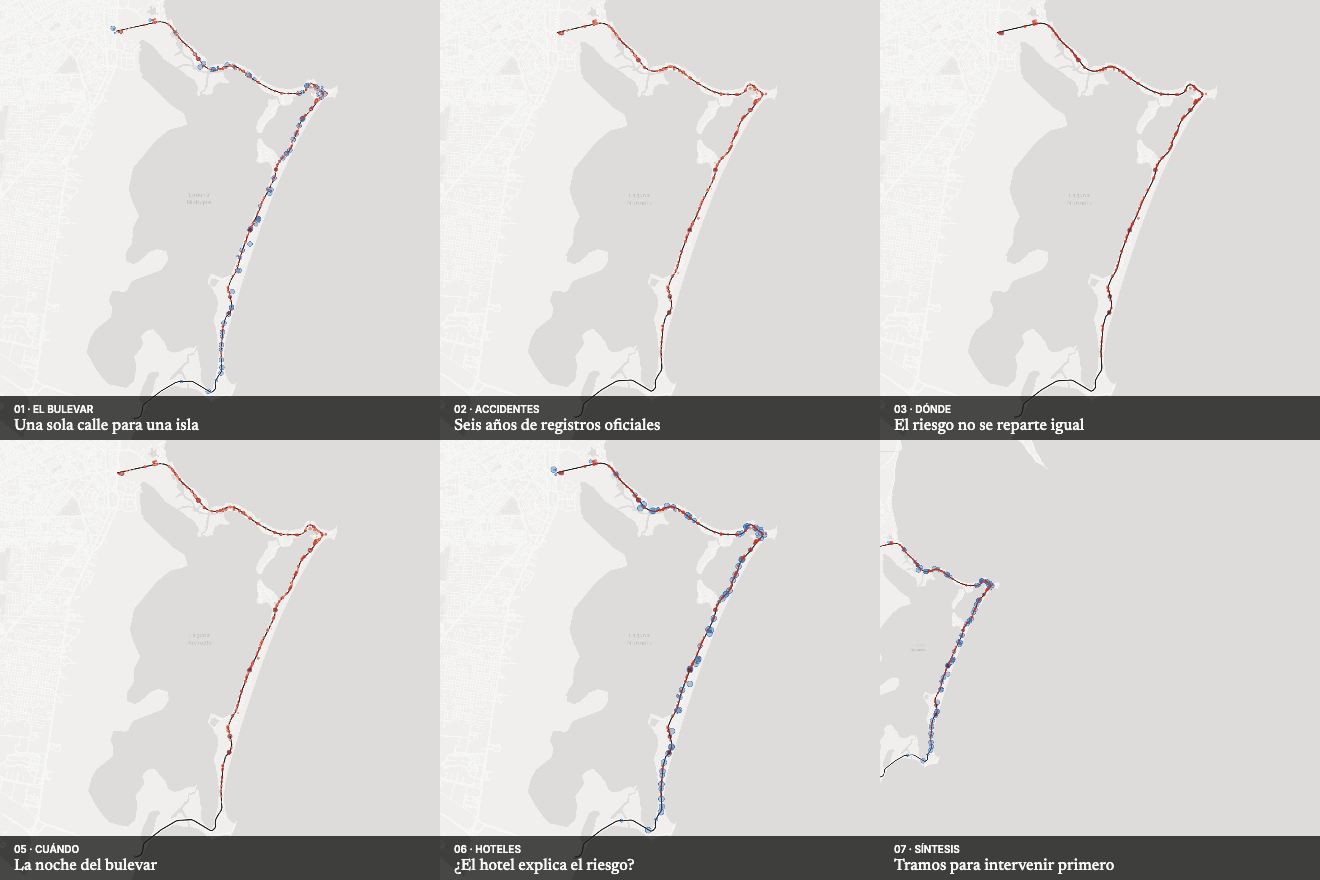 Next in Safe streets and riskThe hotel boulevard