Crossing prioritisation model
Safe Crossings
A territorial model to decide which crossings to treat first in Benito Juárez from spatial justice, universal accessibility and road safety, checked against 35 crossings already treated and against street observation.
In one sentenceRanks more than 2,400 crossings according to the policy question — spatial justice, universal accessibility or road safety — and checks them on the street before investing.
Spanish original: Cruces Seguros
Where is it dangerous to cross and, with limited resources, where should we invest first?
There are more crossings to treat than budget. Priority changes depending on whether it is read from spatial justice, universal accessibility or road safety.
The model reads each crossing through all three lenses and checks it against evidence from crossings already treated and against the street.
Key findings
Between 42% and 48% fewer crashes than expected
In the 35 crossings treated in 2023 and 2024 there were between 142 and 180 fewer crashes than expected without intervention; the symmetric comparison shows crashes −37% and injuries −43%.
The question changes the map
Of the 100 highest-scoring crossings under spatial justice, 10 are also in the top 100 for road safety.
The street confirms the deficit
None of the ten crossings observed met 7 of the 13 criteria; 56% of the 67 people surveyed feel unsafe or very unsafe crossing.
Approach
Step 1
Intersect primary, secondary and tertiary streets and turn their intersections into units of analysis with stable keys.
Step 2
Attach variables measured at five distances — 2 km, 1 km, 500 m, 300 m and 100 m — normalised from 0 to 100.
Step 3
Weight them in three priority models and check the result against treated crossings and street observation.
How to read it
- There is no control group and the series was already declining: the effect is reported as a range.
- 2024 figures are provisional.
- The survey is contextual evidence at four crossings; it does not represent the whole city.
- The model compares identified crossings; it does not locate where new crossings are needed.
Data
Crossing evaluation
Layer of 2,418 crossings with identifiers, priority models, territorial variables and field records.
2020 Population and Housing Census
Total population and groups with specific accessibility needs.
Urban marginalisation and social lag
Indices used in the exclusion dimension.
Traffic crashes (INEGI)
Crashes involving pedestrians or cyclists, injuries and deaths within 100 m.
Crashes at treated crossings
Monthly series 2019–2025 for 35 crossings treated in 2023 and 2024.
Surveys and street observation
67 surveys at four crossings and a 13-criterion rubric at ten crossings (2025).
What supports the method
- OMS (2013)A pedestrian hit at 30 km/h or less has about a 90% chance of survival; at 45 km/h, less than 50% (p. 39).
- Austroads (2018)Improving the whole corridor gives better results than treating isolated sites (p. 14).
Paraphrased; page numbers refer to the PDF consulted. The library is in Spanish.
What you just saw
Variables at five distances from each crossing, normalised and weighted in three models, checked against treated crossings and street observation.
What else this method can answer
- Which crossings to prioritise with a given budget?
- Which interventions worked and which did not?
- Where to verify first on the street?
In other places
Replicable with the street network, census, crash records and, for evaluation, the series of treated crossings.
Line of work
C · Road safety: prioritising corridors and crossings →Do you have a similar question in your city?
Describe the problem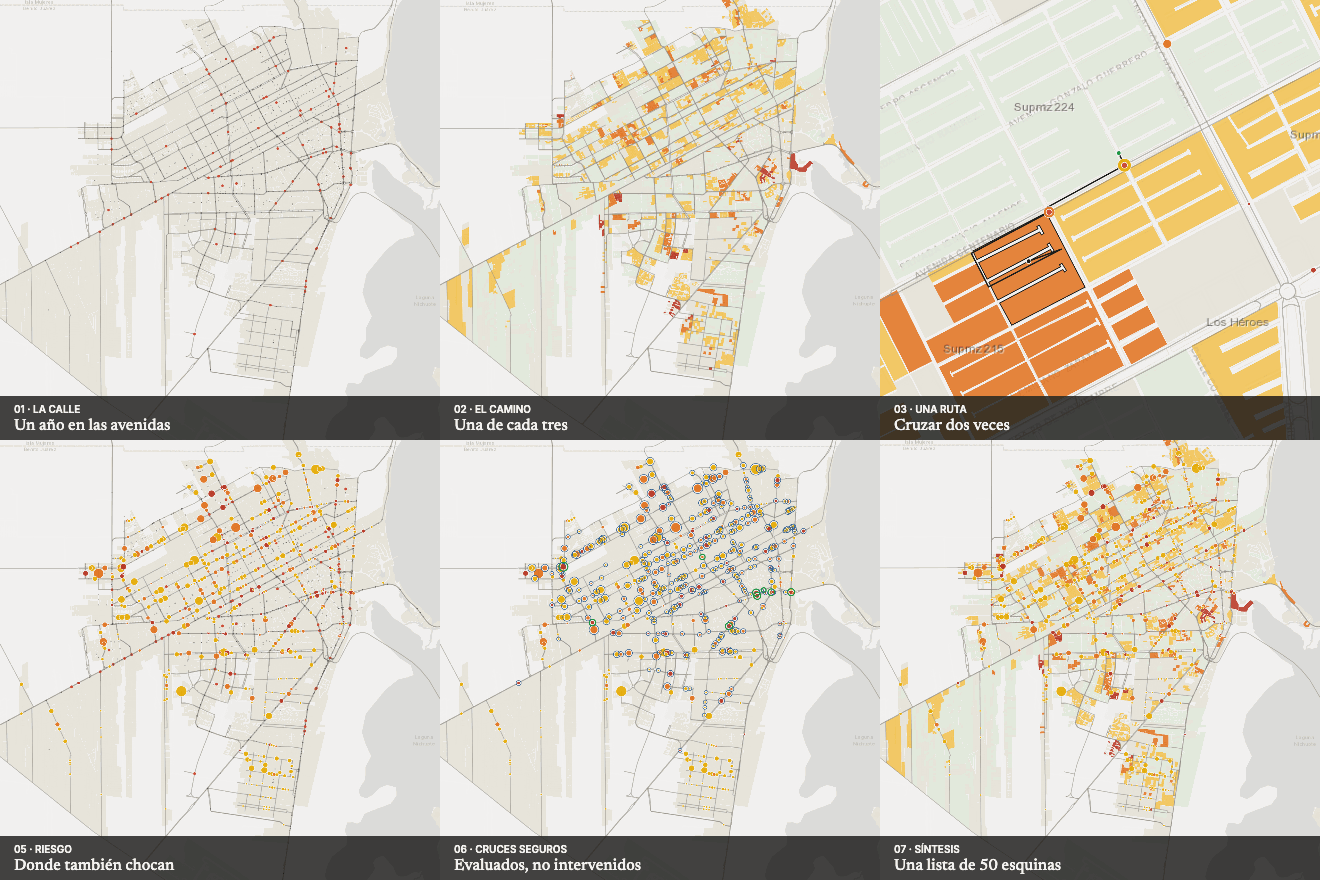 Next in Safe streets and riskCrossing to get there