Urban intensity and proximity
Densify where there is city?
An atlas that crosses the intensity set by current zoning with walking proximity and 15-minute opportunities in Cancún: where zoning allows density with low proximity, where proximity is high but intensity low, and why the best-served areas are losing residents.
In one sentenceTests whether the plan's intensity follows real proximity: here it matches for 18% of the population, less than chance.
Spanish original: ¿Densificar donde hay ciudad?
Where does densifying make sense?
Densifying makes sense where people can live close to what they need. The question is whether the intensity assigned by zoning matches existing proximity, or departs from it.
The cross shows two mismatches and a paradox: high intensity where proximity is low, high proximity where intensity is low, and well-served areas that lose residents.
Key findings
Intensity and proximity rarely coincide
18% of the population lives where intensity and proximity coincide; chance alone would give 20%.
High intensity, low proximity
634 blocks with high FAR and low walking access concentrate 30.8 million permitted m².
High proximity, low intensity
812 blocks with high walking access have low FAR; 75,000 people live there and population fell 12% between 2010 and 2020.
The best-served areas are losing residents
In blocks with the best walking access population fell 7% between 2010 and 2020; in low-access blocks it rose 5%.
Care, the missing dimension
In 86 of 264 superblocks, care is the scarcest dimension within 15 minutes on foot.
Approach
Step 1
Measure walking proximity by block and 15-minute opportunities by superblock across six dimensions of daily life.
Step 2
Read regulatory intensity as the 2026 maximum FAR weighted by lot area.
Step 3
Cross both in classes with explicit thresholds and compare the observed match with what chance would give.
Step 4
Relate proximity to 2010–2020 population change.
How to read it
- Public transport is not evaluated: there is no integrated network in these datasets.
- The access index measures closeness to destinations, not the quality of the walk.
- Classes use explicit thresholds, not a composite index.
Data
Walking access and diversity
Walking access index to daily destinations (0–100) and Shannon diversity by block.
15-minute opportunities
Opportunities by superblock and dimension, on foot and by bicycle.
Maximum FAR, current zoning
Weighted by lot area from the volumetric simulation.
Population 2020 and 2010–2020
2020 census and balance in comparable blocks.
What supports the method
- Levine, Grengs, Shen y Shen (2012)In dense metropolitan areas the effect of proximity between origins and destinations dominates the effect of speed (p. 2).
Paraphrased; page numbers refer to the PDF consulted. The library is in Spanish.
What you just saw
Regulatory intensity crossed with walking access to daily functions.
What else this method can answer
- Where is densifying without nearby city a risk?
- Where is there city but no intensity?
- Why is the best-served area losing residents?
In other places
Requires zoning by block and a walking-proximity indicator.
Line of work
A · Zoning, land and urban capacity →Do you have a similar question in your city?
Describe the problem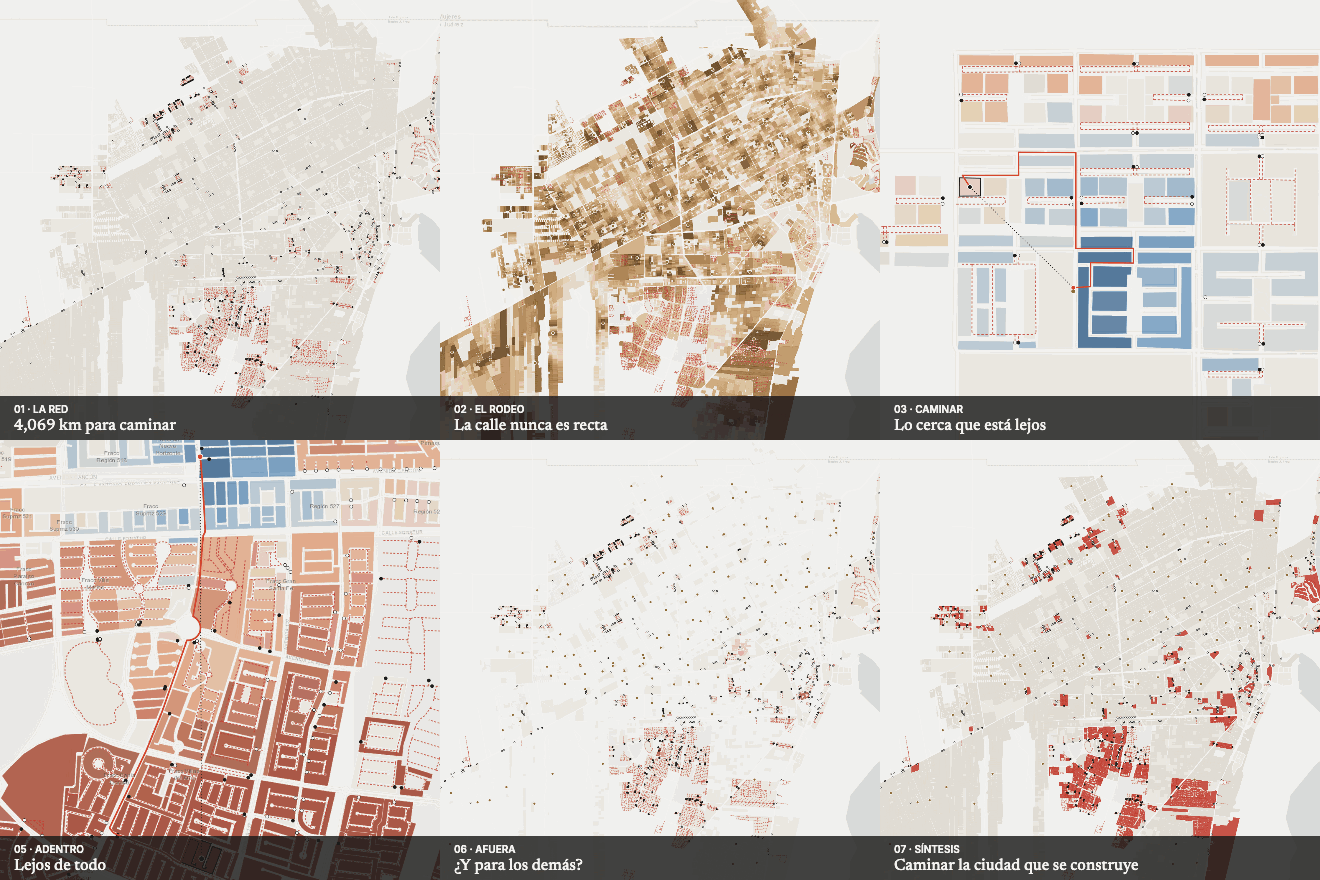 Next in Accessibility and mobilityThe walled city