Urban dynamics and territorial change
Cancún in transformation
A longitudinal reading of population, economic activity and land value to see where the city is changing while its urban structure remains visible.
In one sentenceGives decision-makers a shared reading of how the city changed before discussing what to do.
Spanish original: Cancún en transformación
How is the city changing?
A single variable can hide contradictory trajectories. This project follows population, economic activity, accessibility, diversity, density, land value and built form at the same time to see where change happens and what kind of transformation it is.
The reading does not stop at classifying places: it compares loss and appreciation, and carries the territorial colour onto the linked building footprints without changing the indicator's original scale.
Key findings
Emptying does not necessarily mean losing value
The simultaneous loss of population, businesses and estimated employment can coexist with rising land values.
Transformation combines dimensions
The analysis identifies blocks where population loss, fewer businesses and lower estimated employment coincide.
Visible volume is not buildable capacity
Building footprints give three-dimensional context, but they cannot estimate regulatory capacity without floor-area and coverage ratios, setbacks and other planning conditions.
Approach
Step 1
Read the city longitudinally to separate trajectories that do not appear in a single year or variable.
Step 2
Link a municipal footprint layer to demographic, economic, accessibility, diversity, density and value conditions.
Step 3
Join sources through one master geometry, with coverage audits before building the visual narrative.
How to read it
- Percentage population change is not computed where the starting population is zero; those cases remain as no data.
- Joins between layers are accepted only where there is a spatial match; 517 master blocks remain unlinked in this version.
- Employment is estimated from the midpoints of the business directory's size ranges and should not be read as an exact job count.
- Market land value is available by superblock, while population and activity are observed by block.
- Building footprints are cartographic context; their visual height is not used to compute buildable capacity or indicators.
Data
Master block geometry
Territorial base used to link population, economic activity, functional zones and built form.
Municipal building footprints
330,866 footprints; 303,747 match a master block unambiguously. Height is visual context only.
Blocks with integrated variables
Population 2010–2020, business directory 2010–2025, density, walking and cycling accessibility, Shannon diversity, land values and functional subzone.
Economic activity and estimated employment
Businesses and employment estimated from range midpoints (INEGI business directory, DENUE).
Market land value
Minimum and maximum ranges by superblock, compared through their midpoint.
What you just saw
Population, activity, land value and built form integrated into a single narrative.
What else this method can answer
- What changed in each zone?
- Which trends should be monitored?
- Which questions should come next?
In other places
Replicable with two censuses, a business directory and land values.
Line of work
D · Territorial diagnosis and monitoring →Do you have a similar question in your city?
Describe the problem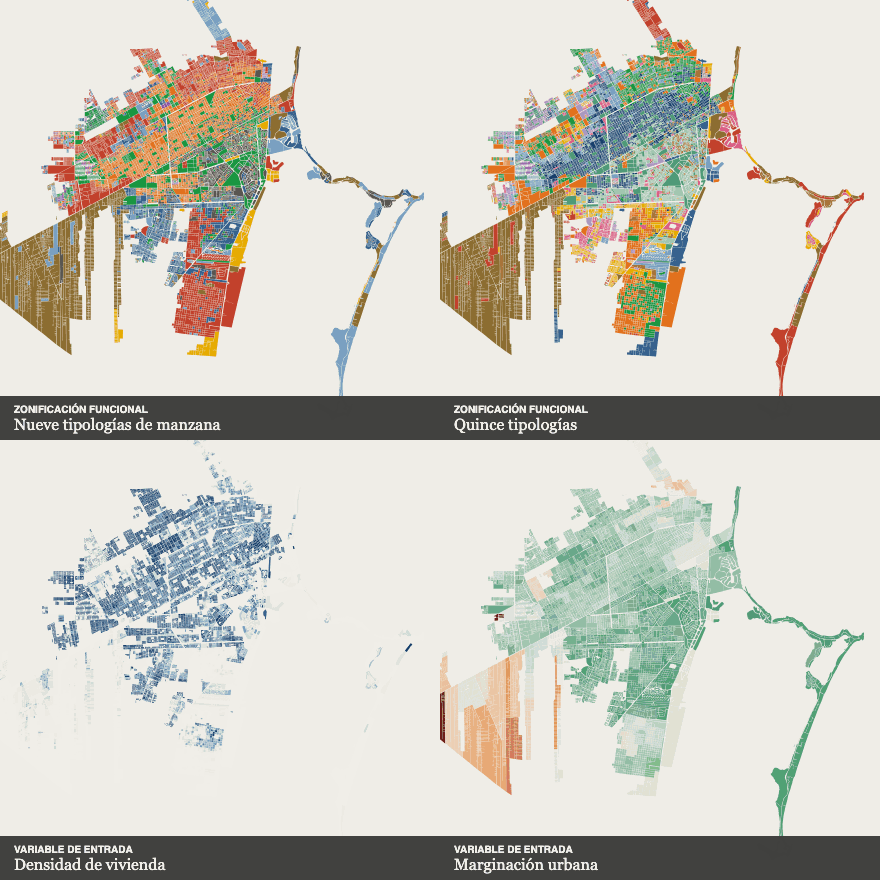 Next in Urban structure and societyHow to read a territory