Consulting · Line D
Territorial diagnosis and monitoring
How is the city changing, and where should we look first?
A diagnosis is most useful when it is updated and compares every zone with the same indicators. A shared reading, with the same indicators for the whole city, supports evidence-based decisions and tracks change.
Questions it answers
- Where does the consolidated city lose population, and why?
- Where are the real centres and corridors?
- Which zones lag behind when measured with the same yardstick?
- Do short-term rentals or rising prices push residents out?
- Who lives and works in hazard zones?
How it is done
- Define the questionWhich decision the diagnosis must support.
- Integrate sourcesCensuses, business directory, land value and hazard layers in one spatial unit.
- Classify with explicit rulesTypologies, spatial statistics and visible thresholds.
- Make it updatableReproducible processes to repeat the reading with new data.
Data
- Population and housing census
- Intercensal survey
- Business directory series
- Land value
- Hazard layers
Built on open sources; the client's own layers are integrated into the same unit.
Possible deliverables
- Diagnostic atlas
- Indicator system by zone
- Monitoring series
- Territorial typologies
- Decision note
Usually useful for
- Planning institutes and departments
- International organisations
- Developers and investors
- Media and civil-society organisations
Projects that back it
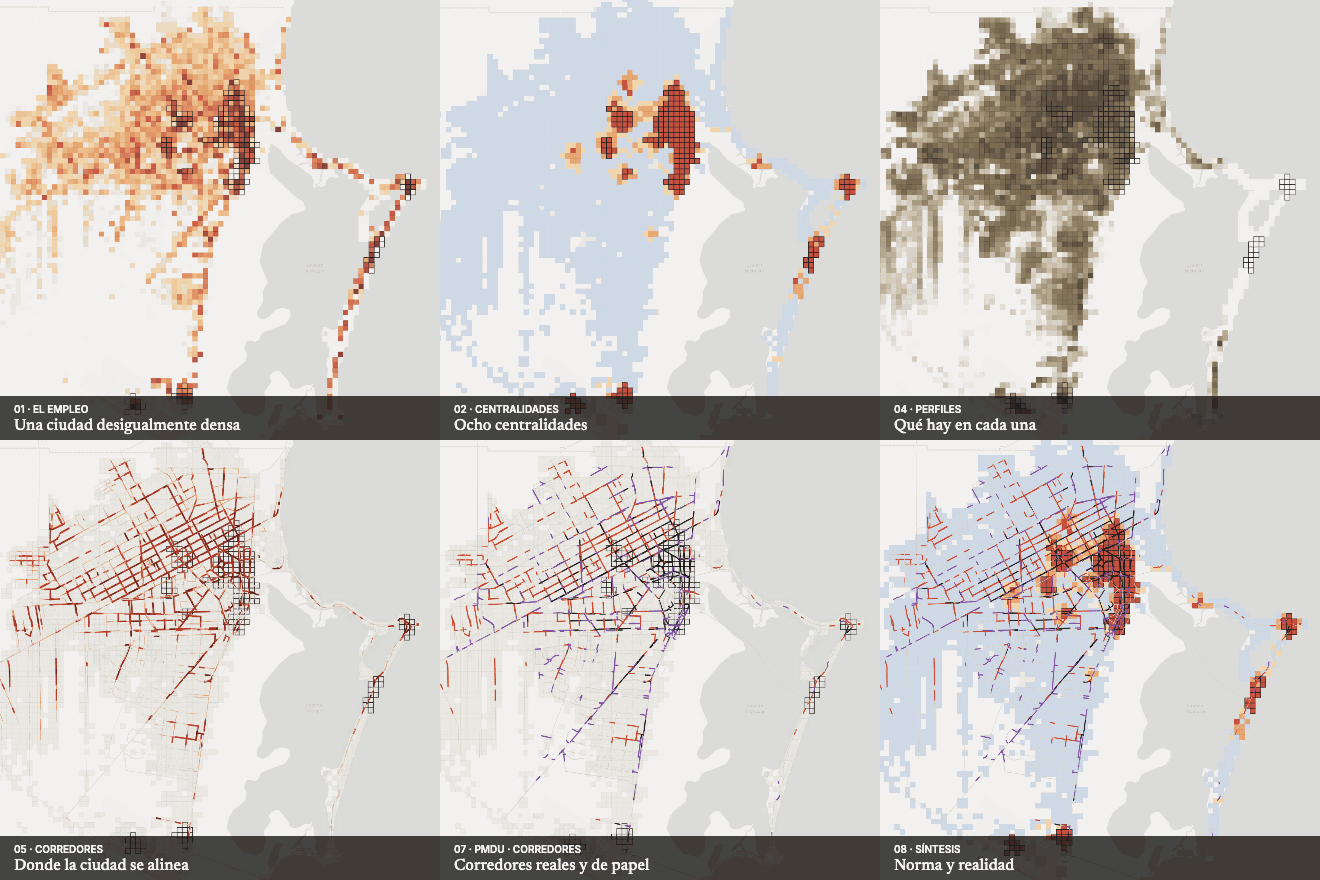 Centres and corridorsCompares real centres with those proposed by the plan, to decide where to recognise or build them.
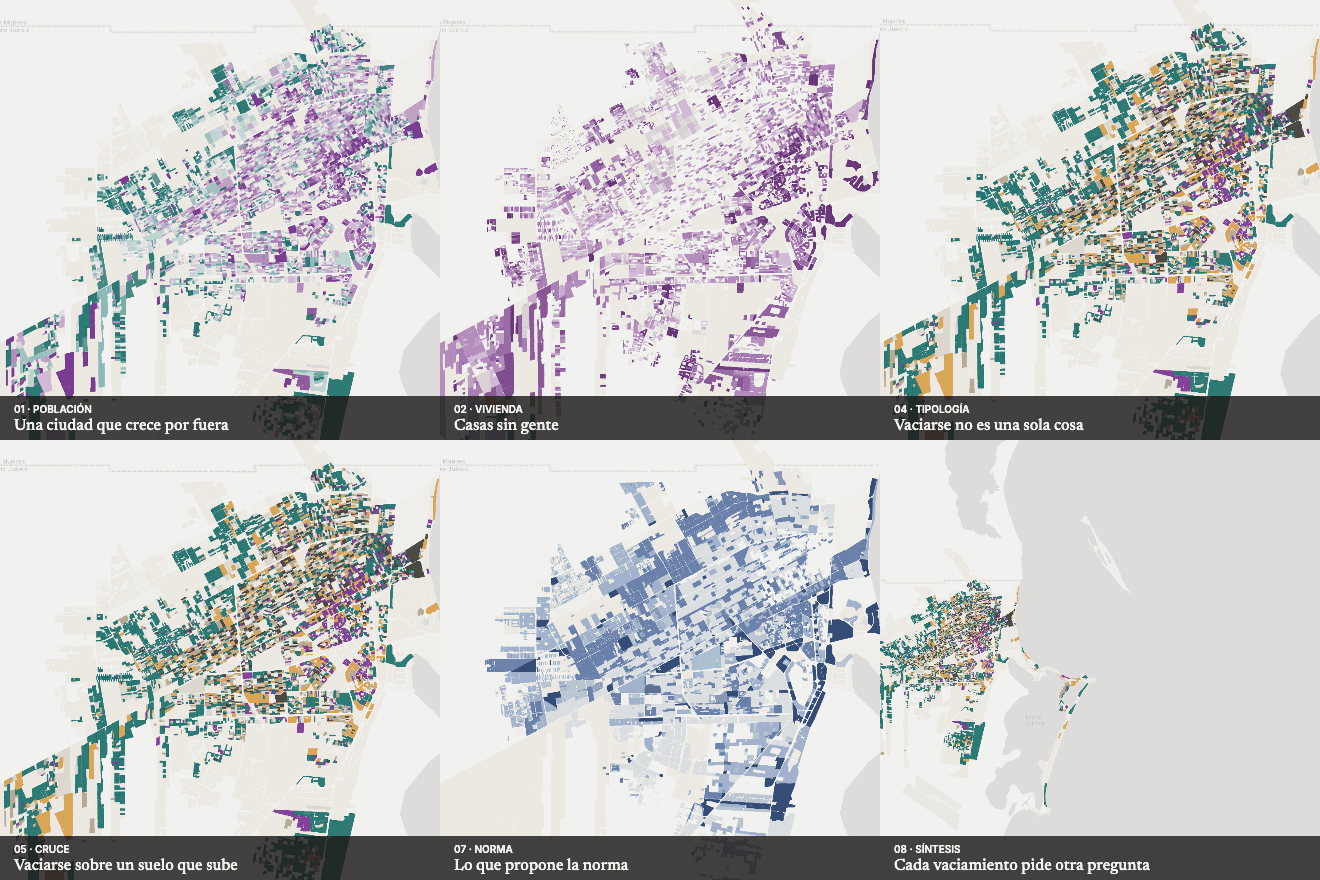 The emptying citySeparates types of emptying that require different policies: replacement, vacancy and loss on appreciating land.
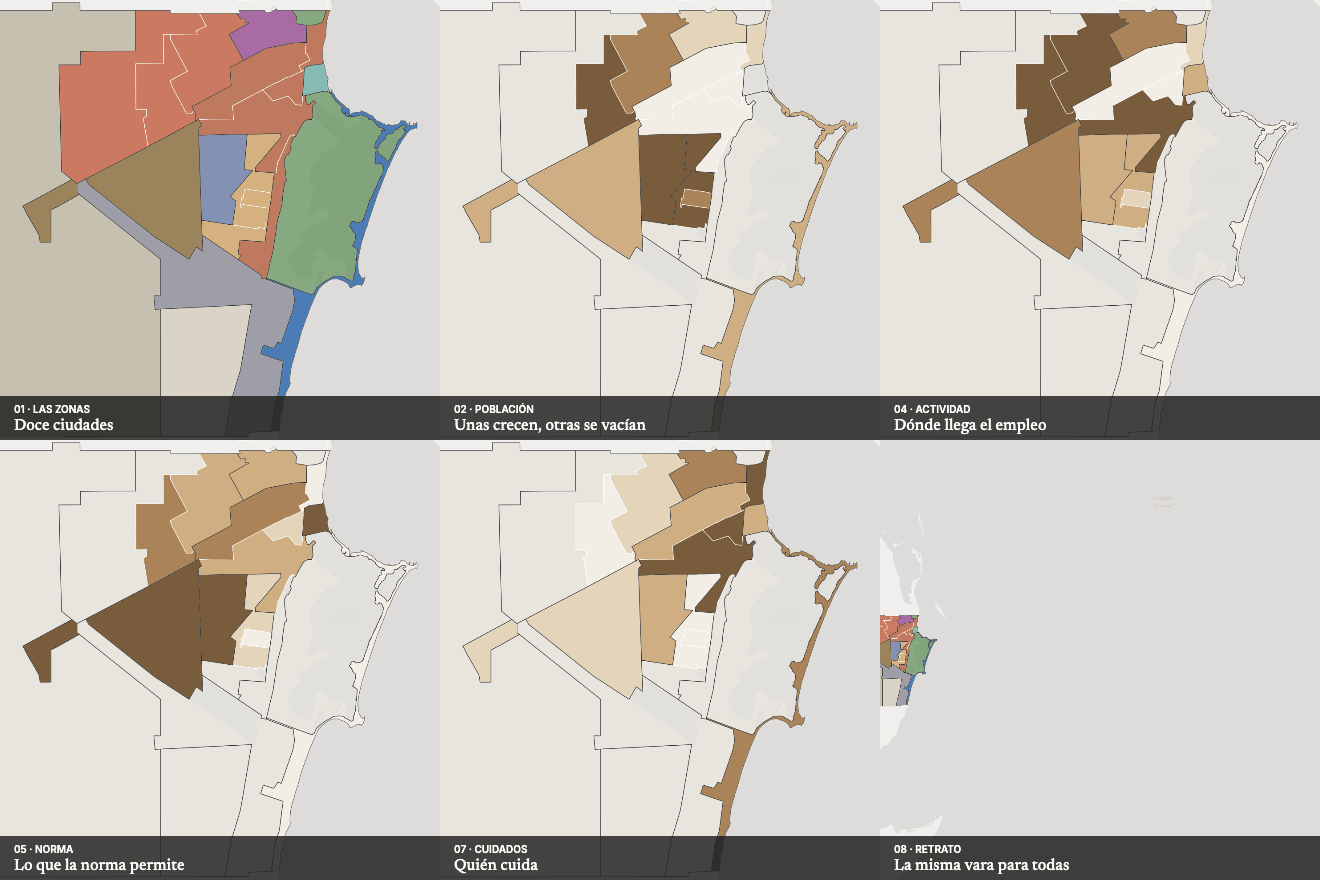 Twelve cities in oneCompares the city's zones with the same yardstick to see which lag behind on each issue.
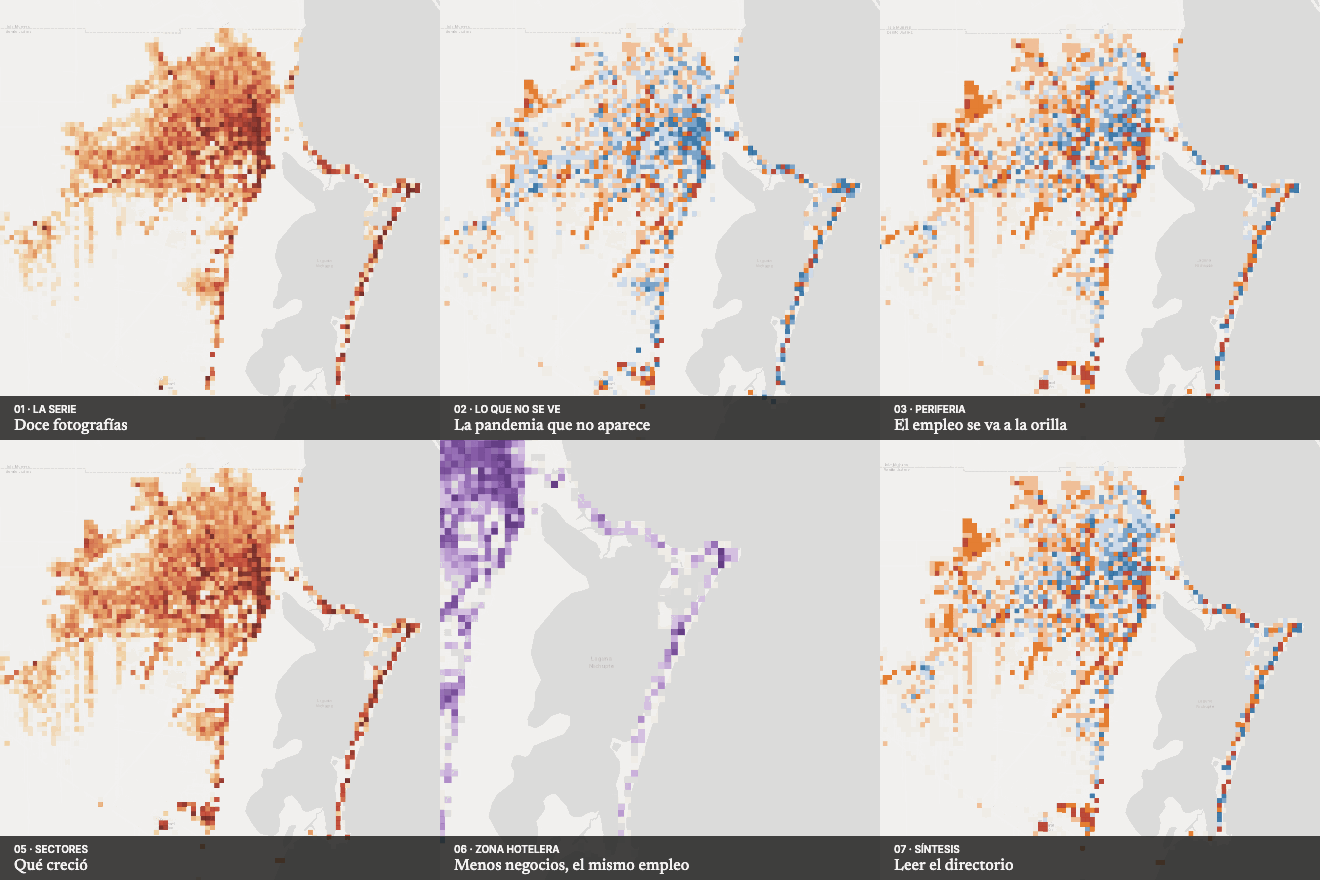 Twelve years of business directoryReads how the city's economic structure changed, knowing the directory misses short-term shocks like the pandemic.
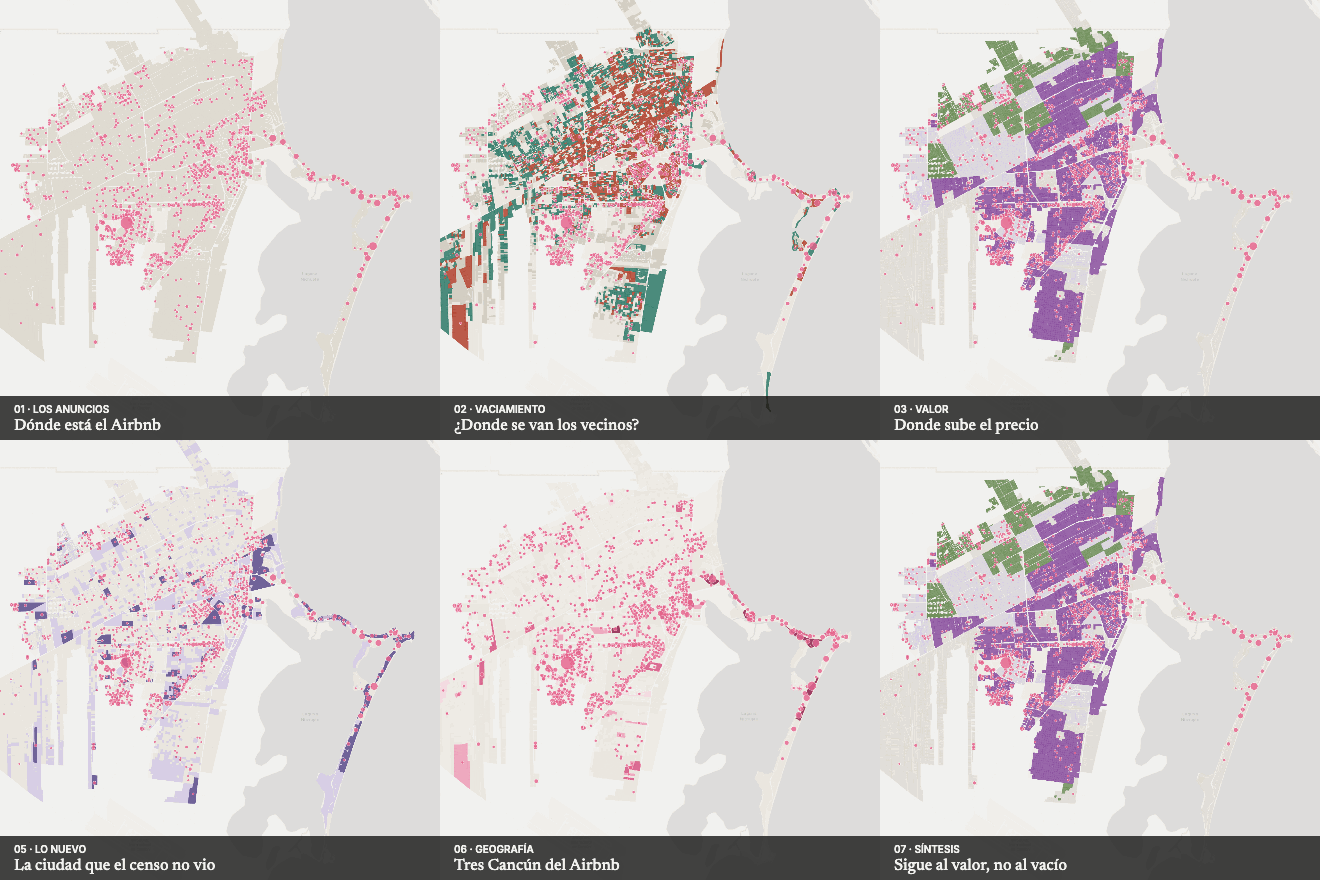 Is Airbnb emptying the city?Orients short-term-rental regulation toward where it concentrates — second homes and appreciating areas — rather than emptying areas.
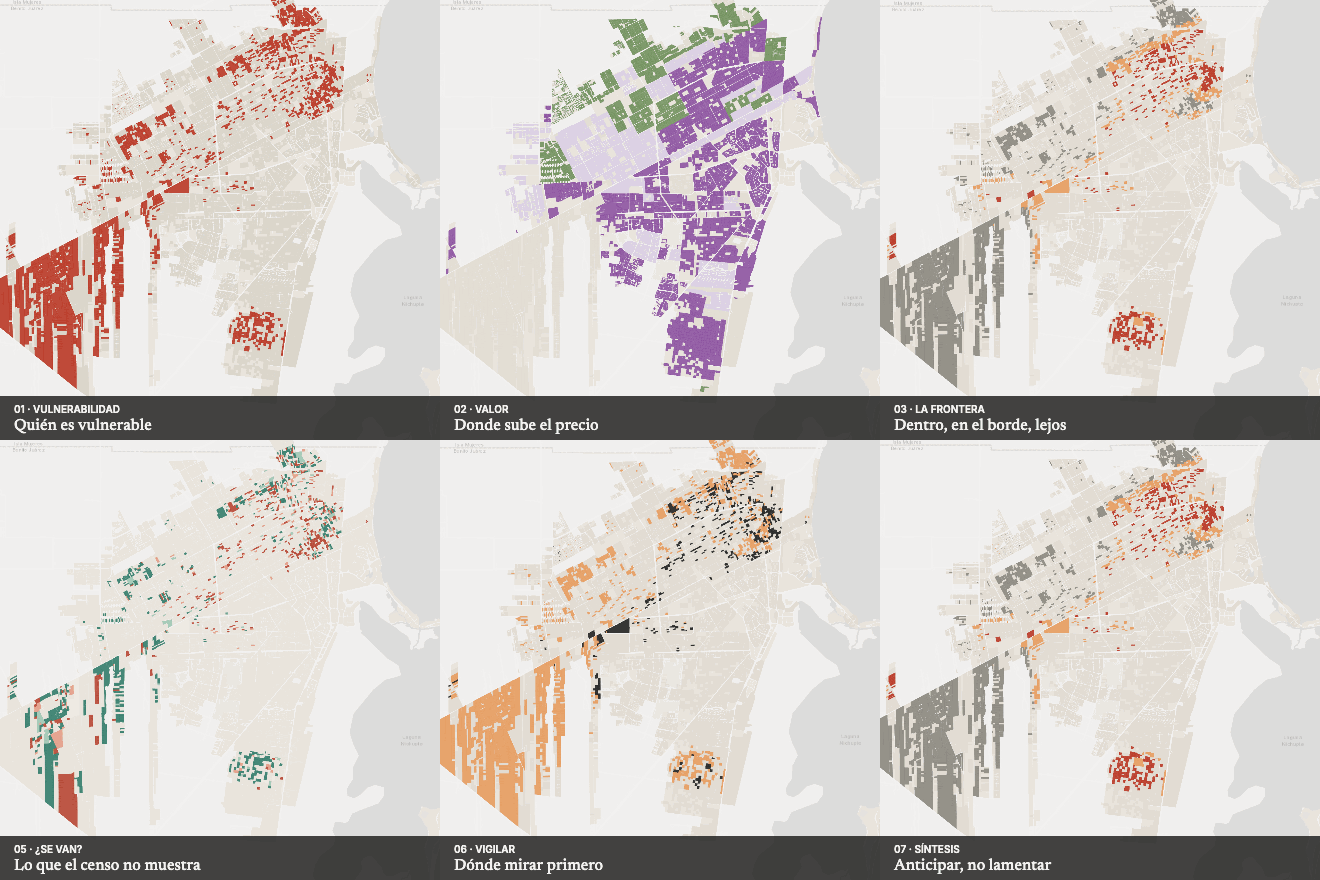 The appreciation frontierAnticipates where to watch for displacement of vulnerable households, although up to 2020 the data do not show it.
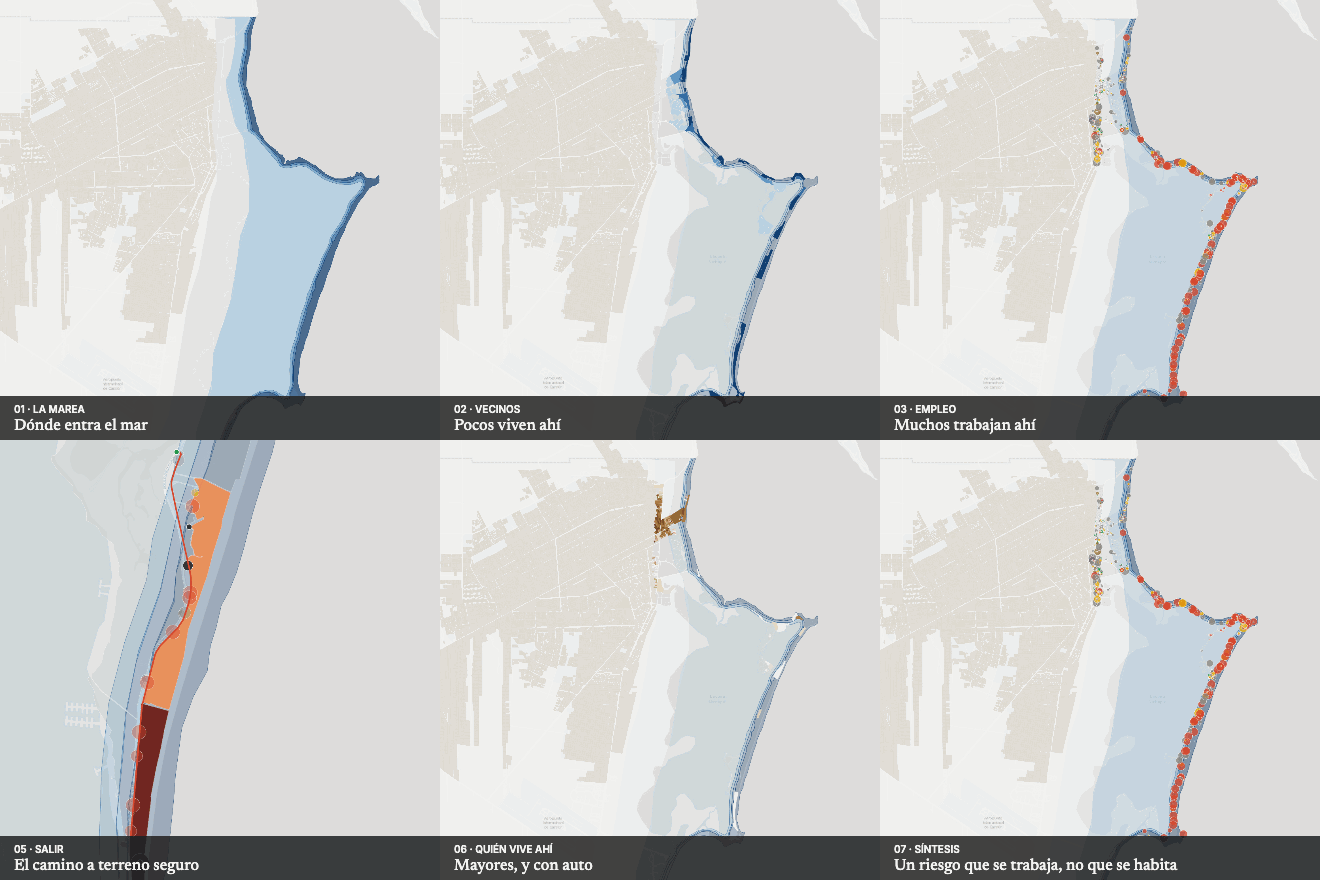 The city under the surgeSizes a risk that is worked in more than lived in: the highest-hazard strip has 10 jobs per resident.
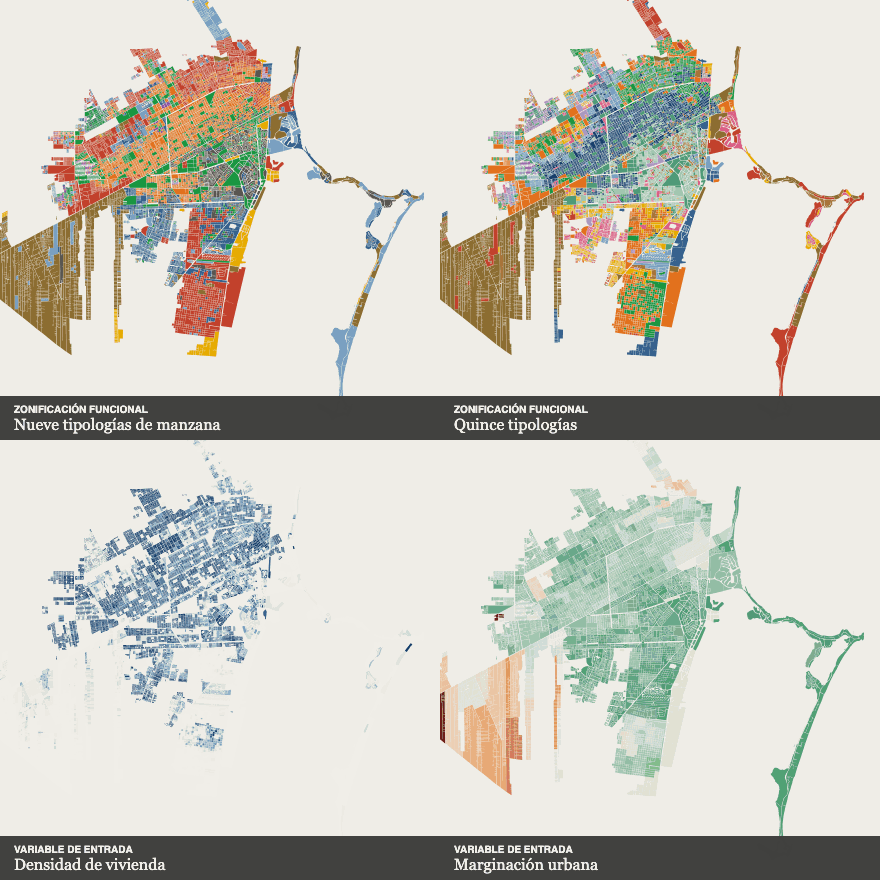 How to read a territoryOrganises the territory into comparable units for planning and monitoring.
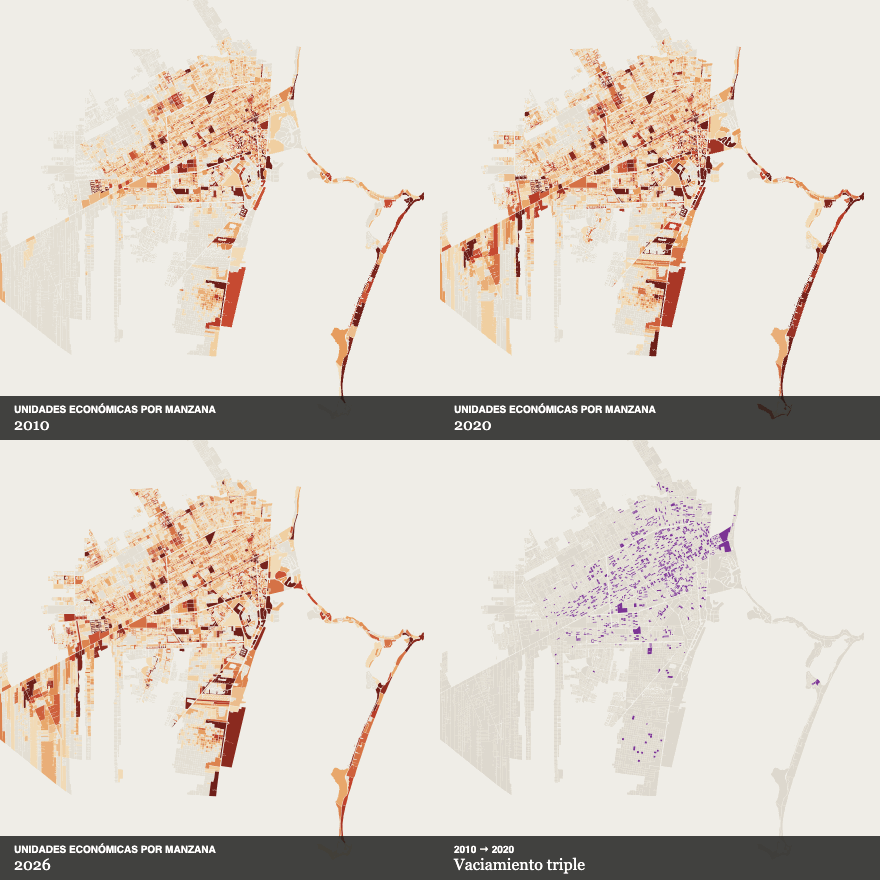 Cancún in transformationGives decision-makers a shared reading of how the city changed before discussing what to do.
Reference reading
From the library, which is organised in Spanish; titles appear in their original language.
- Las zonas metropolitanas de Acapulco, Cancún y Puerto Vallarta2019
- The Global Urban Monitoring FrameworkONU-Hábitat · 2022
- Orientaciones y buenas prácticas de viviendaINFONAVIT / ONU-Hábitat · 2023
- Urban Mobility Indicators for Walking and Public TransportWalk21 · 2019
- Estado de las ciudades de América Latina y el CaribeONU-Hábitat · 2012
- A Future of Polycentric CitiesHendrigan · 2026
- The Hidden Wealth of CitiesBanco Mundial
- Towards Resilient Urban Planning SystemsIUE · 2026
- Portafolio de soluciones basadas en la naturaleza
Build a territorial diagnosis
Tell us what you want to decide. The request arrives with this line already selected.
Propose a project