Urban intensity and land suitability
Selective intensity
An interactive atlas to decide where and how much to intensify in Cancún's urban core: from corridor to segment, from node to parcel, combining parcel structure, urban dynamics and physical capacity.
In one sentenceHelps decide where and how much to intensify a corridor, going down from segment to parcel.
Spanish original: Intensidad selectiva
Uniform or selective intensity?
Structuring corridors usually receive the same intensity along their whole length. But a corridor crosses different cities: stretches of 100 m² lots and stretches of multi-hectare parcels, areas gaining jobs and areas emptying out.
Intensity does not belong to the whole corridor. The corridor sets the possibility; segments, nodes and finally parcels explain where and how much can actually be built.
Key findings
Seven of nine nodes are made of small lots
Within 150 m, seven nodes have at least 90% of parcels under 1,000 m². Only two have medians around 4,000 m²: the same role in the network, incomparable parcel structure.
The corridor changes along its axis
Segments of the same corridor differ in lot size, economic trajectory and population change. Intensity should respond to the city the corridor crosses.
Maximum floor area is not always buildable
Around nodes, most simulated parcels show a gap above 0.05 between the maximum floor-area ratio and what coverage, setbacks, height caps or undersized lots allow. It is a geometric gap, not a transferable right.
The core proposed for intensification is losing people
In 3,439 comparable blocks population fell from 331,177 to 296,740 between 2010 and 2020 (−10%). The prior question is why the core is emptying.
Nodes coincide with the most dangerous intersections
Intersections within 150 m of a node average 20 injured people, against 7.9 elsewhere in the zone; 26 of 48 are in the city's worst 10%. Road safety is a precondition for intensity.
Part of the city is losing activity
Of 4,440 blocks, 1,464 lose businesses and 1,527 lose estimated employment between 2010 and 2020; 839 lose population, businesses and jobs at once.
Approach
Step 1
Read intensity at successive scales — corridor, segment, node and parcel — instead of assigning it uniformly.
Step 2
Combine position with urban dynamics, parcel structure and the physical capacity of each lot.
Step 3
Separate the maximum floor-area ratio allowed by zoning from what the parcel's geometry can deliver.
Step 4
Add road safety (injuries and deaths at each node) as a precondition for intensity.
Step 5
Present suitability as a combination of dimensions, not a score, and keep it separate from the final zoning decision.
How to read it
- Intensity categories E0–E5 are working concepts, not official regulatory categories.
- The population balance compares blocks with a 2010 base (≥ 20 residents); new blocks are excluded.
- Block aggregates are summed whole, without area apportioning; they are exploratory readings.
- Suitability is not a zoning assignment: ownership and infrastructure are missing.
Data
Parcels
Area, size band, conceptual intensity, secondary zoning and distances to the nearest corridor, segment and node.
Urban dynamics by block
Population 2010–2020, businesses 2010, 2020 and 2026, estimated employment and triple emptying.
Corridors and segments
Structuring mobility corridors, split into segments, and nine intersections analysed as nodes.
Volumetric simulation of current zoning
Coverage, maximum and buildable floor-area ratio, floors and the binding restriction per lot.
What you just saw
A chained reading of corridor, segment, node and parcel with parcel structure, dynamics and capacity.
What else this method can answer
- Which nodes can take more intensity?
- Which parcels are candidates by size and zoning?
- Which segments are unsafe to intensify?
In other places
Applies to any corridor with parcels, zoning and urban-dynamics data.
Line of work
A · Zoning, land and urban capacity →Do you have a similar question in your city?
Describe the problem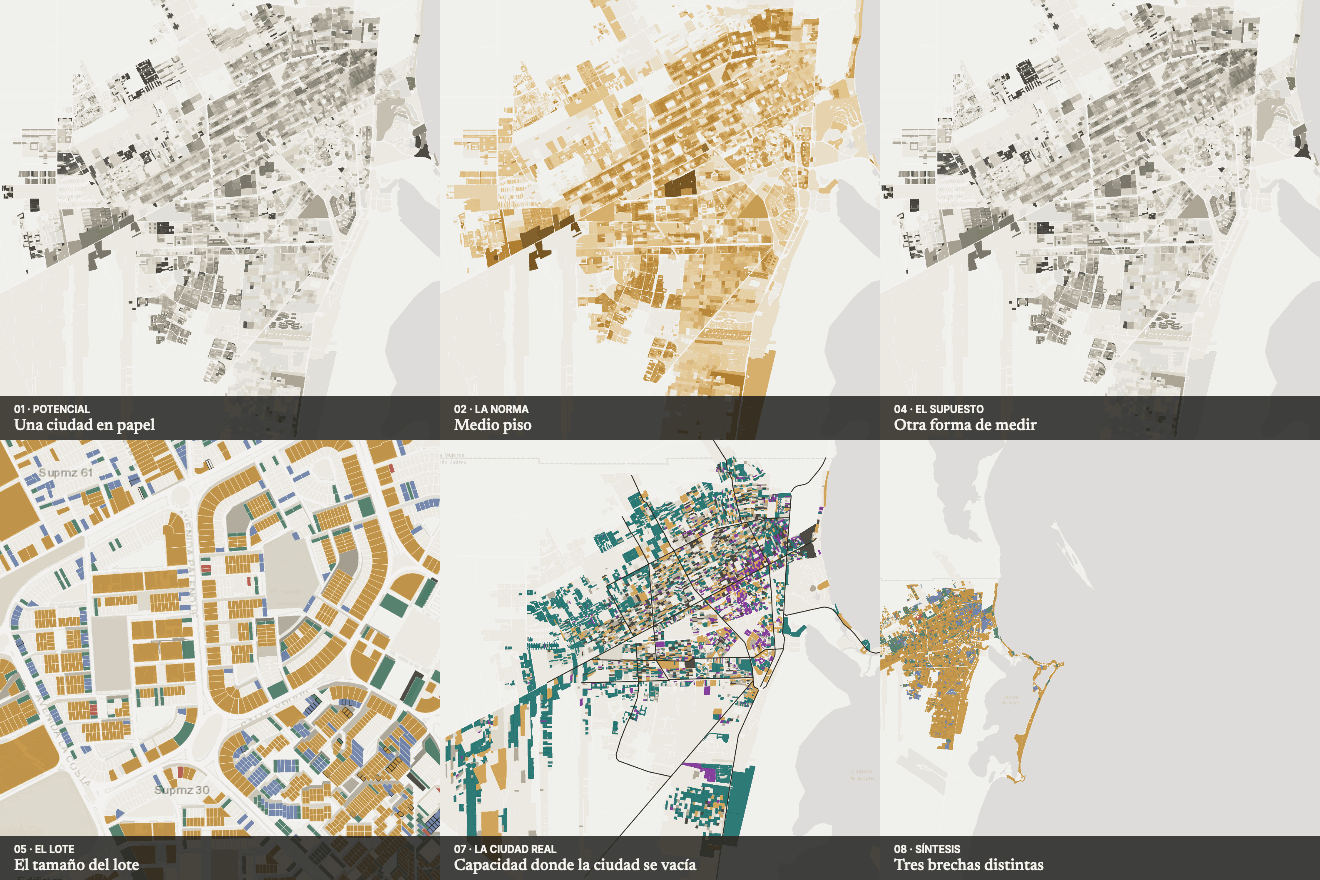 Next in Land, housing and zoningCan the plan be built?