Zoning and buildable capacity
Can the plan be built?
An atlas that breaks down, lot by lot, the gap between what current zoning allows and what fits on each parcel in Cancún: how much is written into the rules themselves, how much depends on how a building is modelled and how much is a physical limit of the lot.
In one sentenceDistinguishes which part of a plan's potential is real and which depends on drafting or modelling.
Spanish original: ¿La norma se puede construir?
How much of what zoning allows actually exists?
A plan assigns possible square metres. Between what the rules allow and what fits on each lot there is a gap, and not all of it comes from the lot: part is written into the rules and part depends on how a building is modelled.
Separating those parts changes the conversation: what can be fixed by drafting the parameter table better should not be debated as potential to transfer.
Key findings
33 million m² that do not fit
Zoning allows 255.5 M m²; the simulation delivers 222.1 M m². The difference is 13% of the potential.
72% of the gap is half a floor
24.2 M m² arise because floor-area ratio divided by coverage requires fractions of a floor. The most common combination (coverage 0.8, FAR 2.0) implies 2.5 floors.
More than half depends on the model
If a partial top floor is allowed within the height cap, the gap falls from 33.4 to 14.0 M m²: 58% depends on the modelling assumption.
Parameters that cannot be reached
In two zoning keys the floor-area ratio exceeds coverage × floor cap: it cannot be reached even on an ideal lot.
One in five lots below the minimum
32,598 lots are below the minimum size for their zoning; in one mixed-housing key, 64%.
Approach
Step 1
Take the simulation for 164,504 lots and rebuild, lot by lot, how the maximum FAR becomes the buildable FAR.
Step 2
Decompose the difference exactly into four terms: whole floors required by the rules, footprint restrictions, floor cap and model residual.
Step 3
Contrast the simulation's assumption (whole floors) with an alternative reading that allows a partial top floor.
Step 4
Cross the gap with lot size, zoning and each block's emptying trajectory.
How to read it
- Everything depends on the volumetric simulation: current built area is not measured.
- The 'partial top floor' is an alternative reading, not a rule in force.
- The gap is not a transferable right: most of it does not exist on any lot.
- 39,352 lots fall outside master blocks: they count in totals, not in the block map.
Data
Volumetric simulation of current zoning
Regulatory and actual coverage, maximum FAR, floor cap, floors built and buildable FAR per lot.
Master block geometry
Lots aggregated by centroid, with the 2010–2020 emptying typology.
What you just saw
Lot-by-lot decomposition of the gap between maximum and buildable floor area.
What else this method can answer
- Which zoning keys cannot reach their own ratio?
- How much does capacity change with a drafting fix?
- What lot size makes the intensity viable?
In other places
Applies to any plan with ratios, floor caps and restrictions per parcel.
Line of work
A · Zoning, land and urban capacity →Do you have a similar question in your city?
Describe the problem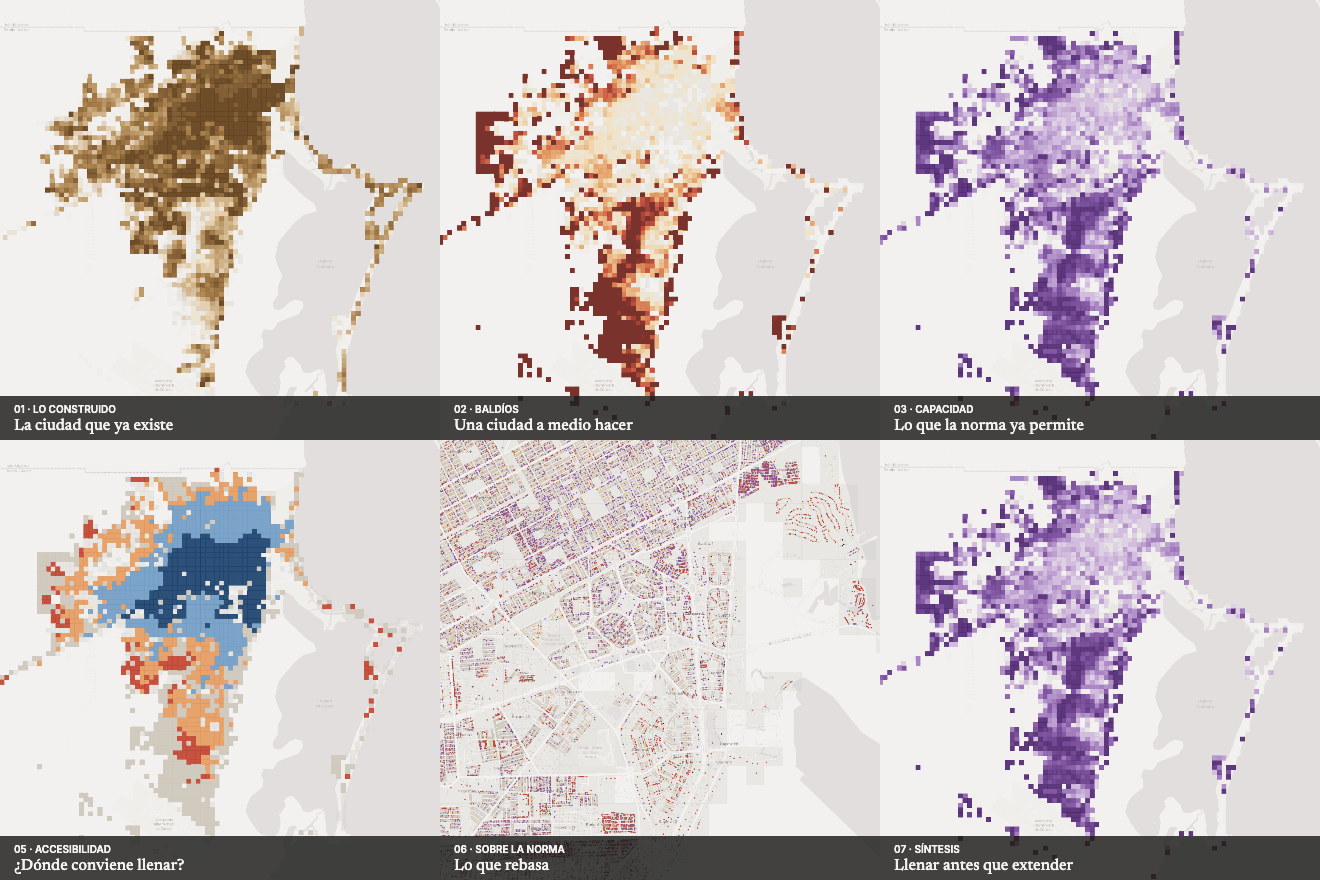 Next in Land, housing and zoningZoning against the built city