Back to Land and Urban Regulation
Bogotá grows far from public services
The quintile with the least proximity receives 28% of the growth with 18% of the people, and it grows upward.
Where Is Bogotá Growing? · Bogotá · Where is Bogotá growing, and does it reach where services already exist?
Between 2016 and 2026, Bogotá’s cadastre added 35.9 million net m². The quintile with the least proximity received 28.4% with 17.6% of the people: 8.1 new m² per person against 4.0 in the quintile with the most proximity. Where services already exist, the city grows little and low.
Read the technical noteThe first two pages, online. The full note is sent by email on request.
The problem
A city that builds far from its services multiplies trips and has to bring in what is missing later. Measuring how much of the growth falls at each level of proximity shows whether the city is moving closer to everyday life or away from it.
What we found
Bogotá grows mostly inward, not toward the edge
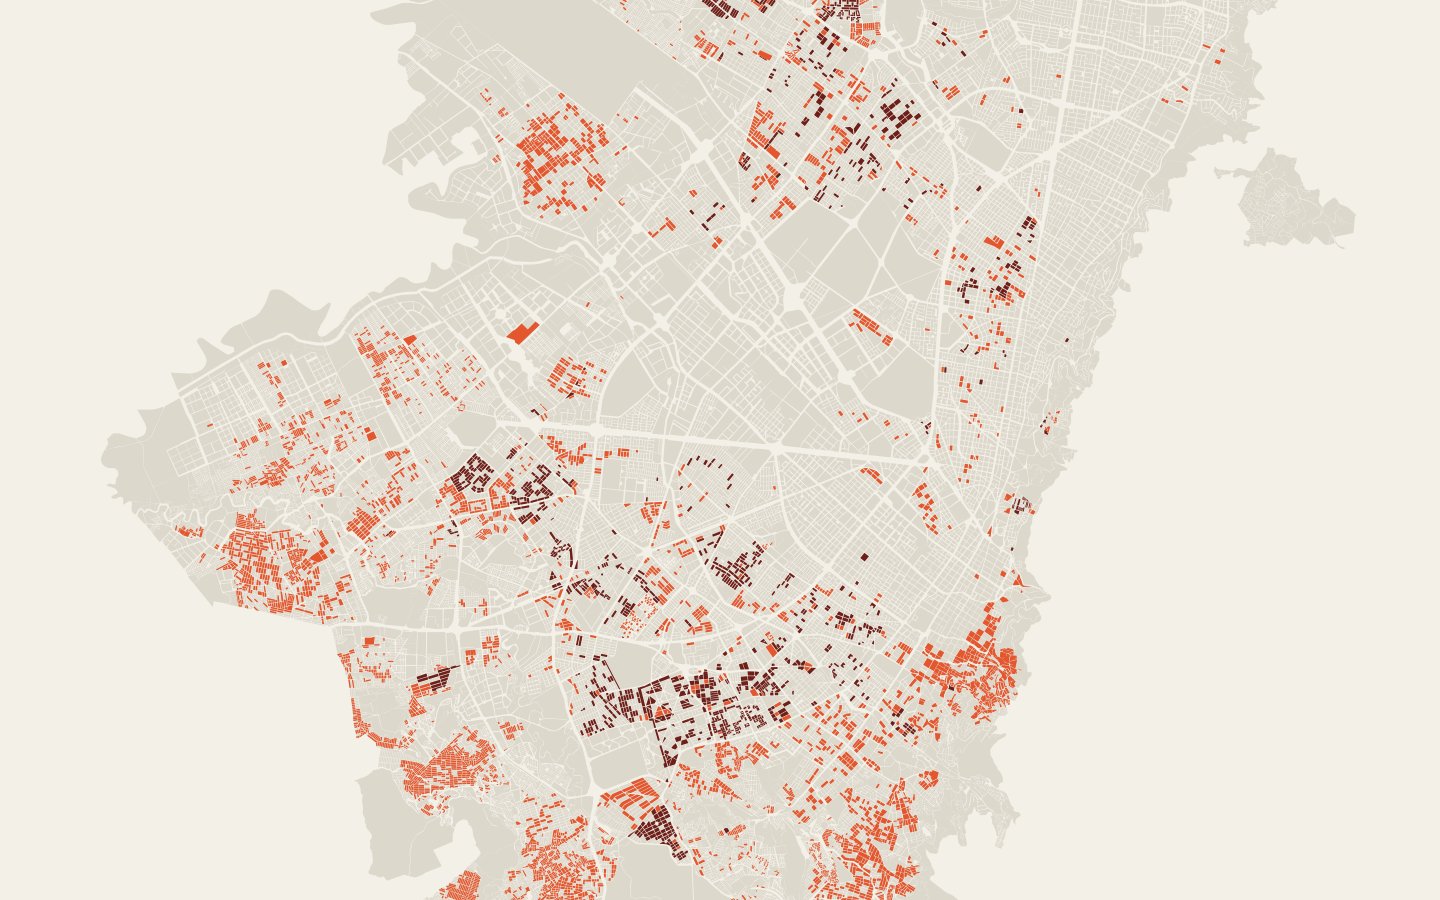
83% of the m² built between 2016 and 2026 went up on city blocks that were already built: it is redensification. Construction on vacant land within 1 km of the urban edge is only 8%. The question about Bogotá’s growth is not only one of expansion: it is what gets built inside the city, and where.
The tallest buildings go up where services are far away
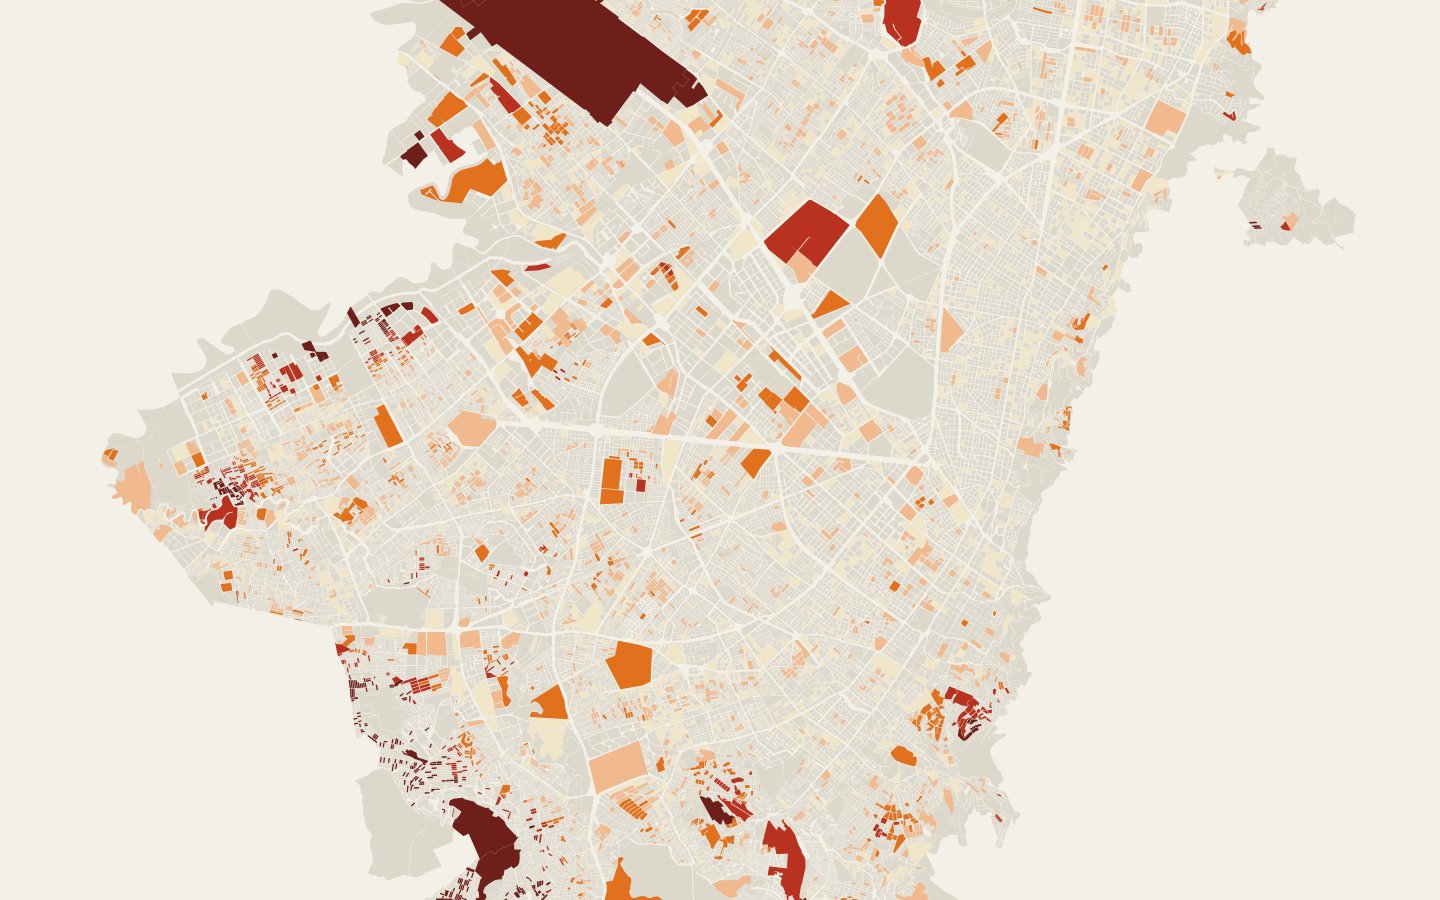
In the quintile with the least proximity, between 50% and 60% of the new m² are in buildings of 6 stories or more; in the quintile with the most proximity, between 16% and 25%. The greatest new density is arriving where the fewest services are nearby.
Far from services, what is missing is public, not retail
The new m² in the quintile with the least proximity are, on average, 2.1 km from a public health facility and 1.9 km from a cultural facility; in the quintile with the most proximity, 0.7 km. Retail follows new housing; public health and culture do not.
The improvement of recent years did not hold
The share of construction in the quintile with the least proximity fell from 31.4% between 2016 and 2021 to 26.4% between 2021 and 2026. But in the last year, from 2025 to 2026, it went back to 31.4%, driven by the most construction on vacant land of the whole series. The trend toward building closer to services is not assured.
286 growth poles with low proximity
Blocks in quintiles 1 and 2 with 2,000 net new m² or more form 286 poles. The ten largest add up to 5.0 million m², 14.1% of the city’s net growth, and 17 of the 20 largest are mainly residential.
Expansion onto vacant land goes to the distant city
Construction on practically vacant land adds up to 7.4 million m², and 53.3% of it falls in the lowest-proximity quintile.
Two ways of growing far from services
In the north and west (Usaquén, Suba, Fontibón and Chapinero) it is high-rises in areas with little public health care, culture and public schooling. In the south, Usme grows at the edge: 82.6% of its new construction lies within 1 km of the urban boundary.
See it on the map
What we recommend
Tie the permits of large projects in quintiles 1 and 2 to developer obligations for public health care and culture, starting with the largest poles in Usaquén, Suba and Fontibón.
The city is already building; the question is which public services arrive with what is built.
Cross-reading of cadastral growth with the Everyday Proximity Index, analysis over time and by height · Bogotá, Colombia · 2026
Facing a similar problem?
We can run this analysis for your city, with your data and your question.
Relevant for
- Planning institutes and departments
- Municipal governments and councils
- Developers and real estate funds
- Firms that prepare plans
We also
Related projects