The center gets collected on time; the outskirts do not
Collection runs late on 2% of days in the Centro and Pocitos municipalities and on 21% to 24% in Cerro, Casavalle, Maroñas and Colón. Complaints do not show it.
Is it collected on time? · Montevideo · Is waste collected on time in every Montevideo neighborhood?
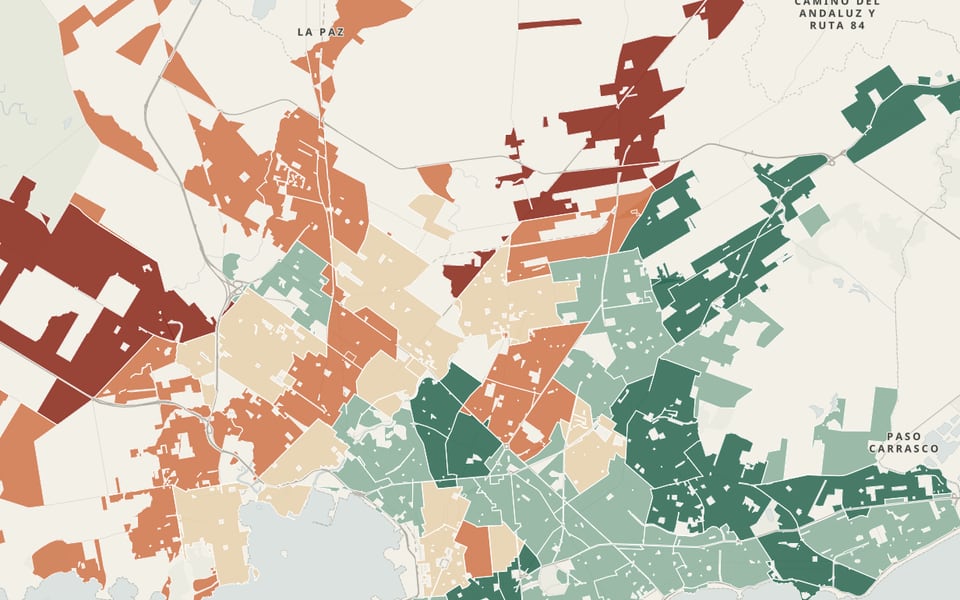
Eleven million daily snapshots of 13,647 containers in Montevideo, from 2024 to 2026, show that the center gets collected on time and the outskirts do not: collection runs late on 2% to 3% of days in the Centro and Pocitos municipalities and on 21% to 24% in Cerro, Casavalle, Maroñas and Colón. Complaints do not follow the delays.
Read the technical noteThe first two pages, online. The full note is sent by email on request.
The problem
Waste collection is the urban service people notice most when it fails. The daily record of each container makes it possible to measure whether the truck comes when it should, without waiting for someone to complain.
What we found
The center gets collected on time; the outskirts do not
A container is late when more days go by without pickup than scheduled, plus one. In the Centro and Pocitos municipalities that happens on 2% to 3% of days; in the Cerro, Casavalle, Maroñas and Colón municipalities, on 21% to 24%. In Manga-Toledo Chico, Jardines del Hipódromo, Villa García and Paso de la Arena it reaches 26% to 30%.
Where collection lags most, each container serves more people
Manga-Toledo Chico has 166 people per container and Villa García 214, compared with fewer than 110 in most neighborhoods. The outskirts get less effective frequency and more load per container at the same time.
Complaints do not reveal the delays
The link between delays and container complaints is weak across neighborhoods (rank correlation 0.17) and absent month to month within each neighborhood. The neighborhoods with the most delays complain as much as, or less than, the best served ones: complaints cannot measure the service; the daily snapshot can.
Irregular collection coincides with the distant city
Across neighborhoods, collection delays and the Everyday Proximity Index have a rank correlation of −0.85: where everyday life is far away, waste also takes longer to leave.
2,637 containers chronically late
2,637 containers miss the deadline on a quarter of the days or more, and 142 on half the days or more. 83% of the chronic cases are in the Cerro, Casavalle, Maroñas and Colón municipalities.
Three times a week, more delays
On average per container, those collected three times a week miss the deadline on 16.7% of days; those collected six times, 4.6%. The six-times-a-week routes are almost all in the Centro and Pocitos municipalities.
Delays rose in 2026
Between January and September 2026, containers missed the deadline on 18.9% of days, against 13.8% in 2024 and 12.9% in 2025.
See it on the map
What we recommend
Review first the routes in the Cerro, Casavalle, Maroñas and Colón municipalities with the most chronically late containers: frequency, number of containers per person and route compliance. Publish the daily snapshot as a service indicator.
The daily snapshot measures the service; complaints do not.
Reconstruction of each container’s pickups, delays against the scheduled frequency, and cross-reading with complaints and proximity · Montevideo, Uruguay · 2026
Facing a similar problem?
We can run this analysis for your city, with your data and your question.
Relevant for
- Public services and public works departments
- Citizen services and innovation offices
- Public safety, coexistence and civic justice
- Traffic and urban management
We also
Related projects
 Where does demand concentrate, and which problems recur?What do people complain about, where, and how long does it take to answer them?
 Where does demand concentrate, and which problems recur?Which problems recur, where, and which promises are kept?
 Mobility and AccessibilityHow close is everyday life on foot in each neighborhood?