The outskirts wait twice as long
1.7 million complaints: the west and north wait 14 to 17 days; the center, 6 to 7.
The city that complains · Montevideo · What do people in Montevideo complain about, where, and how long does it take to answer them?
1.7 million complaints to Montevideo’s Single Complaints System, from 2010 to 2026: 100 per 1,000 residents a year. The median complaint is closed in 13 days, but the outskirts wait more than twice as long as the center, and 90,000 complaints have been open for more than 90 days.
Read the technical noteThe first two pages, online. The full note is sent by email on request.
The problem
A complaints system is at once a record of problems and a record of who is able to complain. Reading it per resident, by department and by response time separates demand from need.
What we found
The outskirts wait twice as long
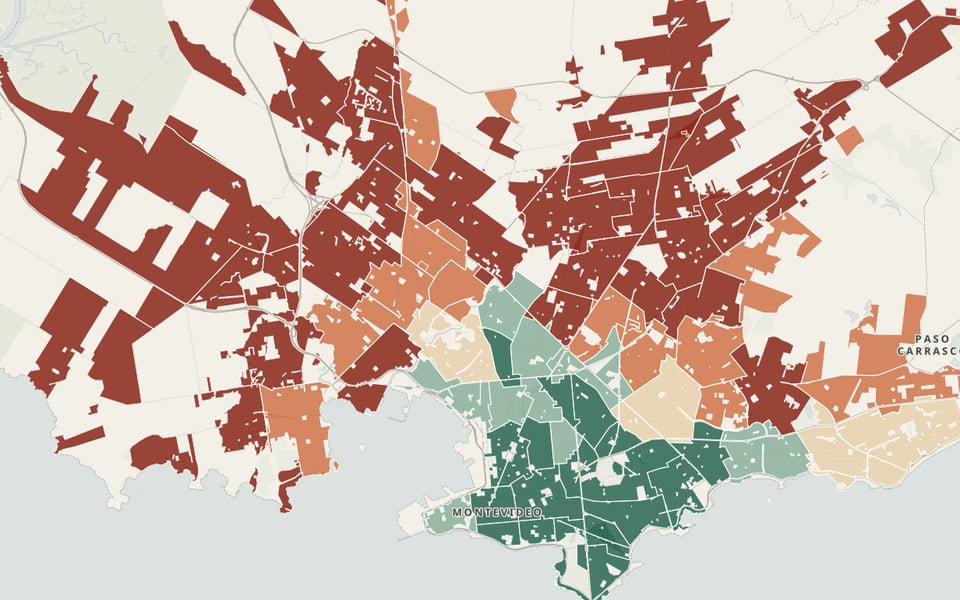
Between 2023 and 2025, the median time to close was 17 days in the Cerro municipality, 15 in Casavalle and 14 in Colón, compared with 6 to 7 in Centro, Prado, Malvín and Maroñas. It reaches 29 days in Paso de la Arena and 24 in Manga-Toledo Chico.
Green spaces are the bottleneck
Sanitation closes complaints in 4 days, street lighting in 8 and cleaning in 12; streets and sidewalks in 43 and green spaces in 206. Of the 98,197 open complaints, 90,201 have been open for more than 90 days: 43,000 about cleaning and 25,000 about green spaces.
Those who are best served complain the most
The highest rates are in Prado-Nueva Savona, Bañados de Carrasco, Atahualpa and Ciudad Vieja (140 to 189 complaints per 1,000 residents a year); the lowest, in Malvín Norte, Casavalle, Las Canteras, Villa García and Conciliación (55 to 76), four of which are among the ten neighborhoods with the most delays in waste collection. The volume of complaints does not measure need.
Tree pruning, containers and street lighting each have their own hot spots
Tree-pruning complaints cluster in Colón Sureste, Carrasco and Flor de Maroñas (16% of complaints with 7% of the population); full-container complaints, in Malvín, Colón Sureste and Nuevo París; street-lighting complaints, in Villa Española, Sayago and Nuevo París.
Response time improved greatly over fifteen years
The median number of days to closure fell from 98 in 2010 to 8 in 2025; even so, one in four complaints takes more than 64 days.
Complaining does not follow proximity
Across neighborhoods, the complaint rate is unrelated to the proximity index (rank correlation 0.08): those with less nearby do not complain more.
Cleaning and street lighting, more than half of demand
Of the 100 complaints per 1,000 residents a year, 35.5 concern cleaning, 22.4 street lighting, 15.8 sanitation and 12.1 green areas.
See it on the map
What we recommend
Set closing-time targets by municipality and by area, with priority for green areas and for the Cerro, Casavalle and Colón municipalities, and order the response by measured need rather than by complaint volume.
Complaint volume shows who complains; response time shows who gets served.
Rates by neighborhood and department, resolution times, open complaints and spatial hot spots · Montevideo, Uruguay · 2026
Facing a similar problem?
We can run this analysis for your city, with your data and your question.
Relevant for
- Public services and public works departments
- Citizen services and innovation offices
- Public safety, coexistence and civic justice
- Traffic and urban management
We also
Related projects
 Where does demand concentrate, and which problems recur?Is waste collected on time in every neighborhood?
 Where does demand concentrate, and which problems recur?What do drivers’ reports reveal?
 Where does demand concentrate, and which problems recur?Which problems recur, where, and which promises are kept?