Half a million complaints from behind the wheel
Potholes, crashes and floods reported by the people who drive.
The city drivers report · What do drivers’ reports reveal?
Five years of driver alerts in Cancún: 26 superblocks account for two thirds of the reports, and 81% of flooded streets lie outside the areas marked by the risk atlas.
Read the technical noteThe first two pages, online. The full note is sent by email on request.
The problem
Every day, people driving in Cancún report crashes, flooded streets, potholes and traffic jams. It is not an official record: it is a signal, with known biases.
Read by type, place and hour, and checked against official sources, it helps decide where to inspect first.
What we found
Drivers filed more than half a million reports in five years
Between April 2021 and March 2026 there were 540,849 alerts: 60,543 for potholes, 38,023 for crashes and 26,150 for flooded streets.
Most reported flooding is outside the zones the atlas marks
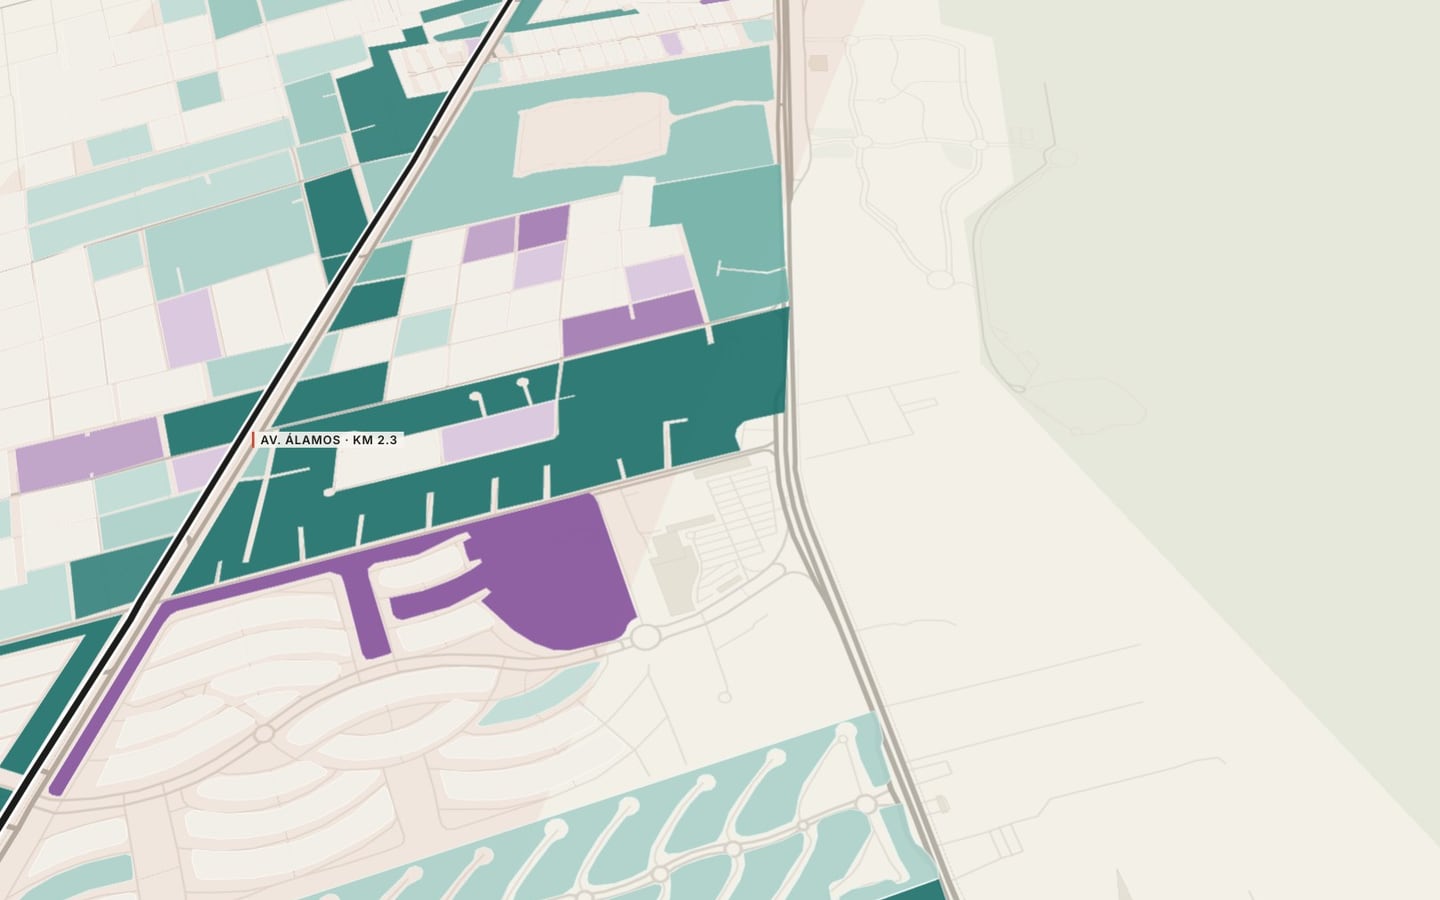
Flooded-street alerts are 3.1 times more frequent in high flood zones than traffic alerts, but 81% occur outside the mapped zones. The streets with the most flooding alerts are Huayacán, Bonampak and Kukulcán.
A tenth of the superblocks account for two thirds of the alerts
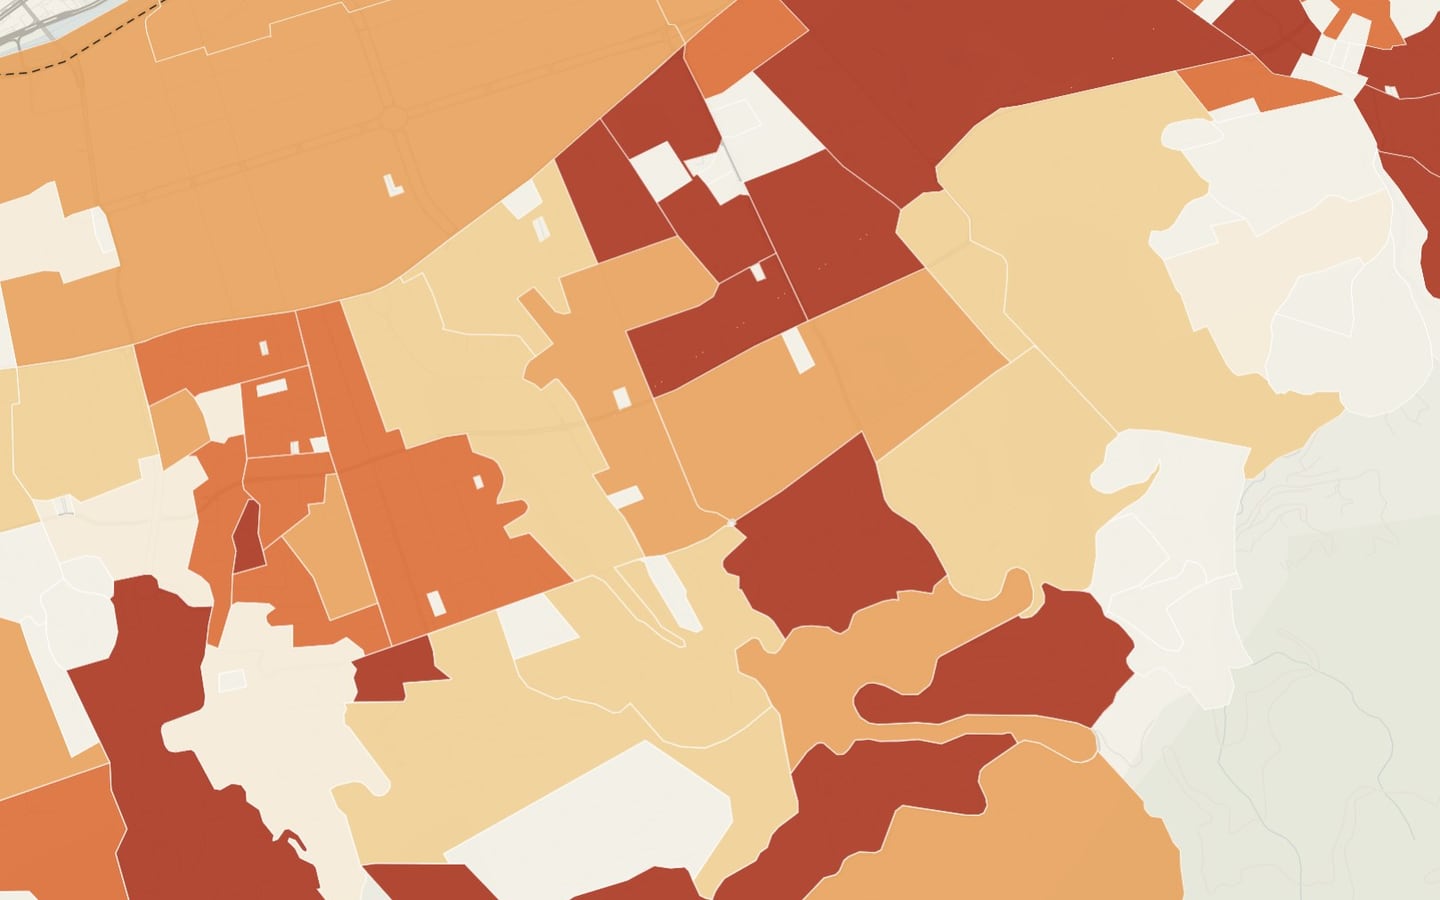
The 26 superblocks with the most reports, 10% of the total, account for 68% of crash, flooding, pothole and traffic alerts.
Congestion peaks at 2 p.m. and delay at 6 p.m.
Congested stretches peak at 2 p.m. and accumulated delay at 6 p.m.; Kukulcán, Kabah and López Portillo add the most delay.
Low-income areas report half as much per resident, because they have fewer cars
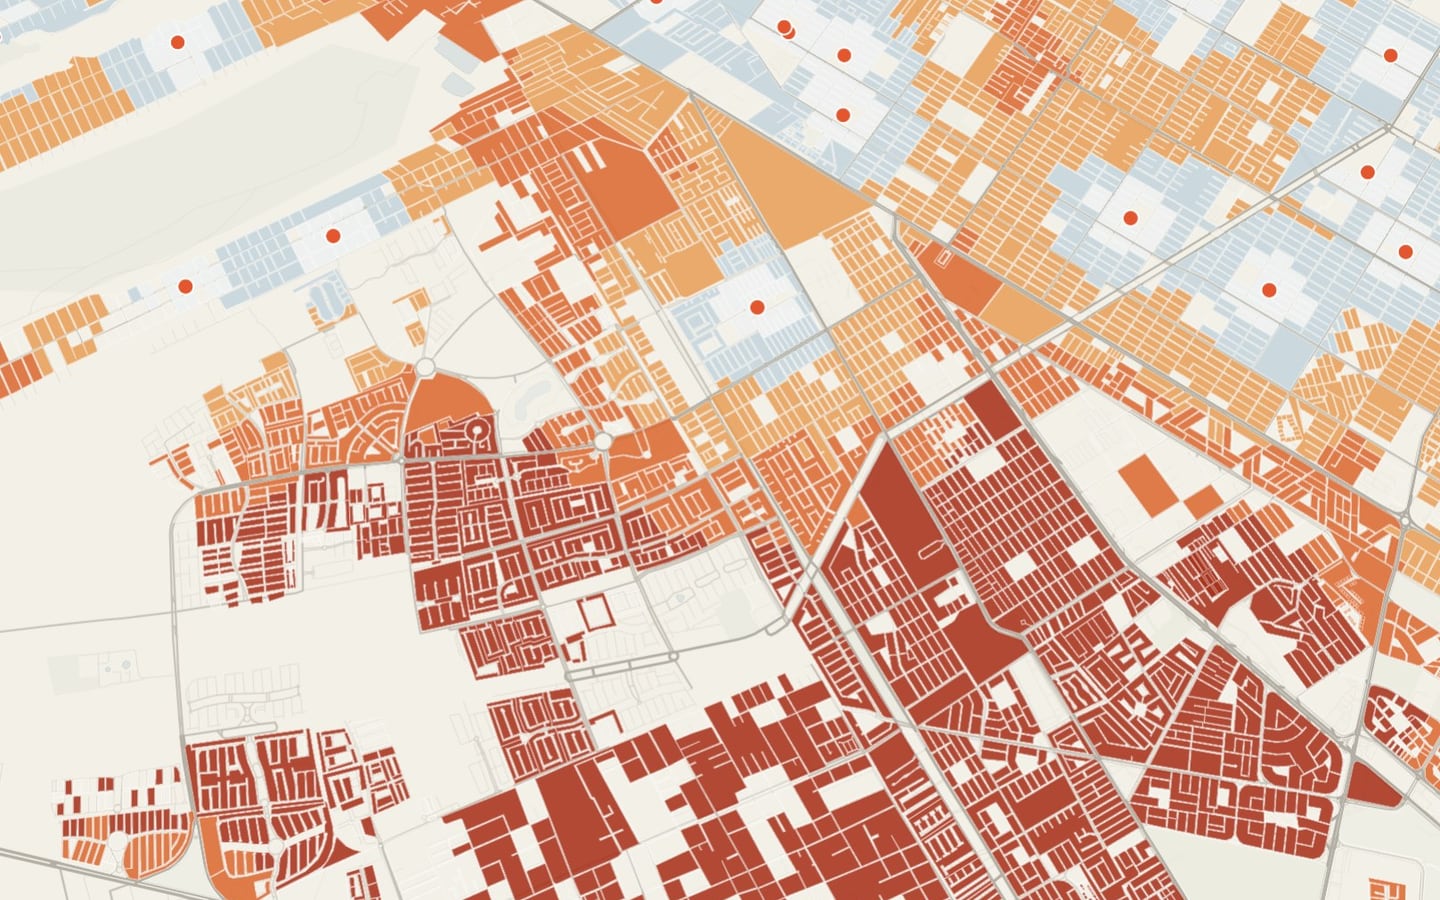
Where D and E households predominate, alerts per resident are half those elsewhere: only 26% of homes have a car, versus 58%.
Per driver, low-income areas report streets in worse condition
Per thousand homes with a car, low-income areas report more potholes (229 versus 150) and more crashes (47 versus 36). The highest rates are in SM 90, 232, Cielo Nuevo, 75 and 233.
See it on the map
What we recommend
Schedule pothole repair by the rate per car-owning household, not by raw counts: with raw counts, the areas that report less always end up last.
Waze portrays the city of those who drive; read per driver, it shows that streets in low-income areas are in worse shape.
Alert cleaning and aggregation, comparison with the risk atlas, hourly analysis and cartographic storytelling · Benito Juárez, Quintana Roo · 2026
Facing a similar problem?
We can run this analysis for your city, with your data and your question.
Relevant for
- Public services and public works departments
- Citizen services and innovation offices
- Public safety, coexistence and civic justice
- Traffic and urban management