Back to Land and Urban Regulation
Bogotá is a continuum
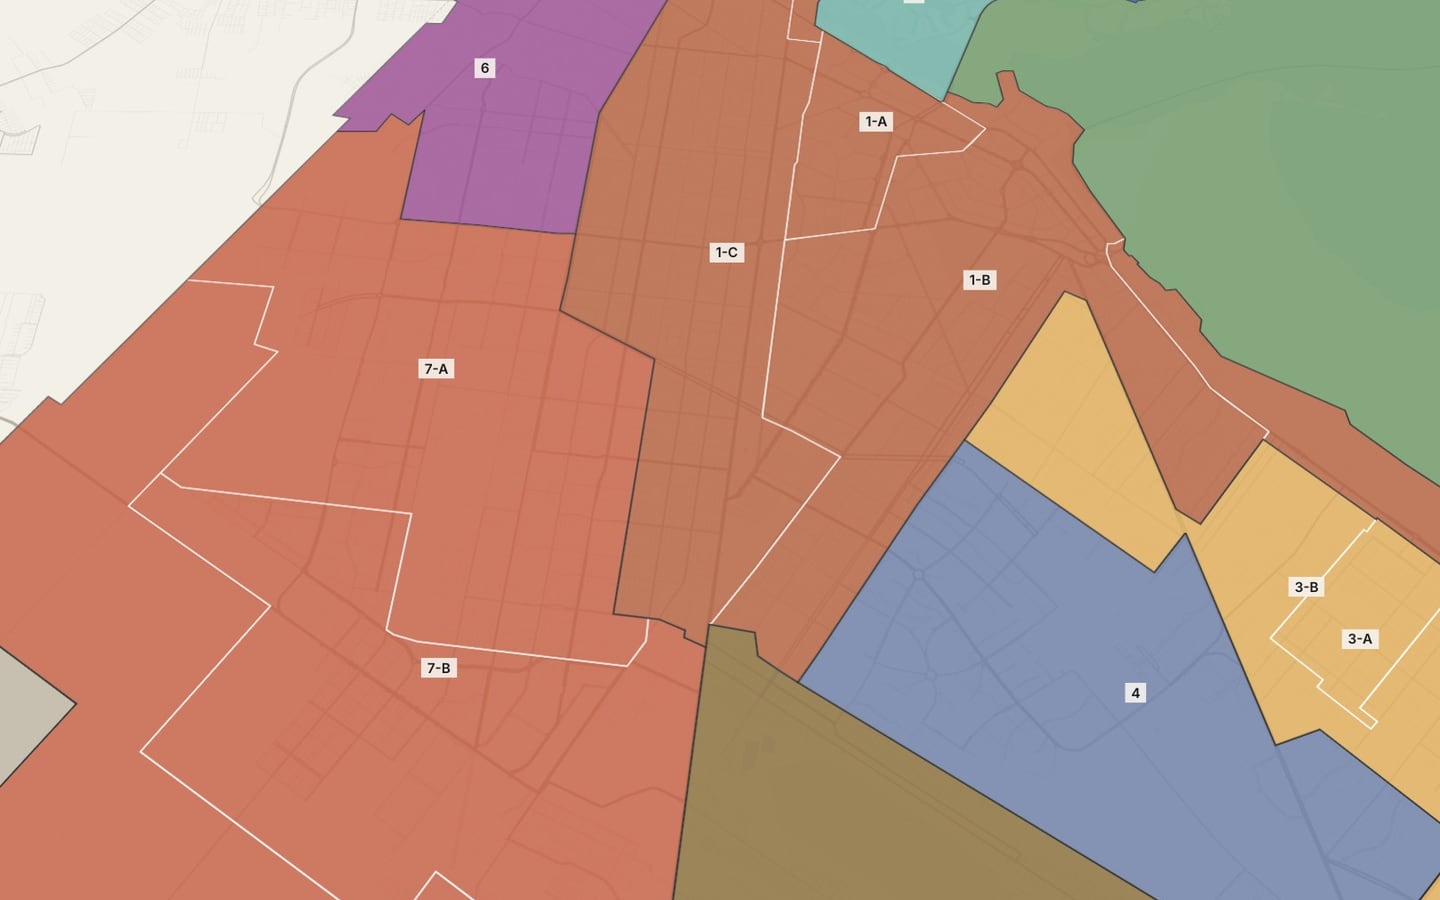
The POT’s 33 UPLs with the same profile sheet: five profiles and what the locality hides.
The UPLs Compared · Bogotá · How do Bogotá’s UPLs and localities compare with one another?
Bogotá does not split into clear-cut pieces: it is a continuum with five recognizable profiles. The biggest difference among the 29 urban UPLs is not in average proximity, which ranges from 35.8 to 60.3, but in how many people are left far away: from 2.1% to 53.7% in the bottom quintile.
Read the technical noteThe first two pages, online. The full note is sent by email on request.
The problem
The 2021 POT organizes local planning into 33 UPLs (local planning units). Comparing them with the same profile sheet shows what they have in common, where they diverge and what is lost when the city is read by locality.
What we found
The urban UPLs group into five profiles
Comparing density, proximity, height, new construction, crashes and transit, the urban UPLs form five profiles: dense periphery (14 UPLs, with 56.5% of the people), consolidated southern pericenter, high-rise north with little proximity, ring of facilities and activity, and expanded center. The differences between profiles are gradual, not jumps.
The difference between UPLs comes from public services
What most separates the UPLs with little proximity from the rest is the distance to public health and culture. The median distance to a public health facility is about 2 km in Usaquén, Britalia and Tibabuyes, and 602 m in Lucero.
More density does not mean more services nearby
Among the urban UPLs, population density is barely related to proximity: Tibabuyes is among the densest and among those with the least proximity. Height is related: the UPLs with taller buildings have less proximity and more vacant housing.
Looking by locality hides large differences
Within the locality of Suba there are UPLs with proximity indices from 37 to 54. The Historic Center, on the other hand, is split among three localities. To compare the city, the UPL is a more precise scale than the locality.
More height, more vacant housing
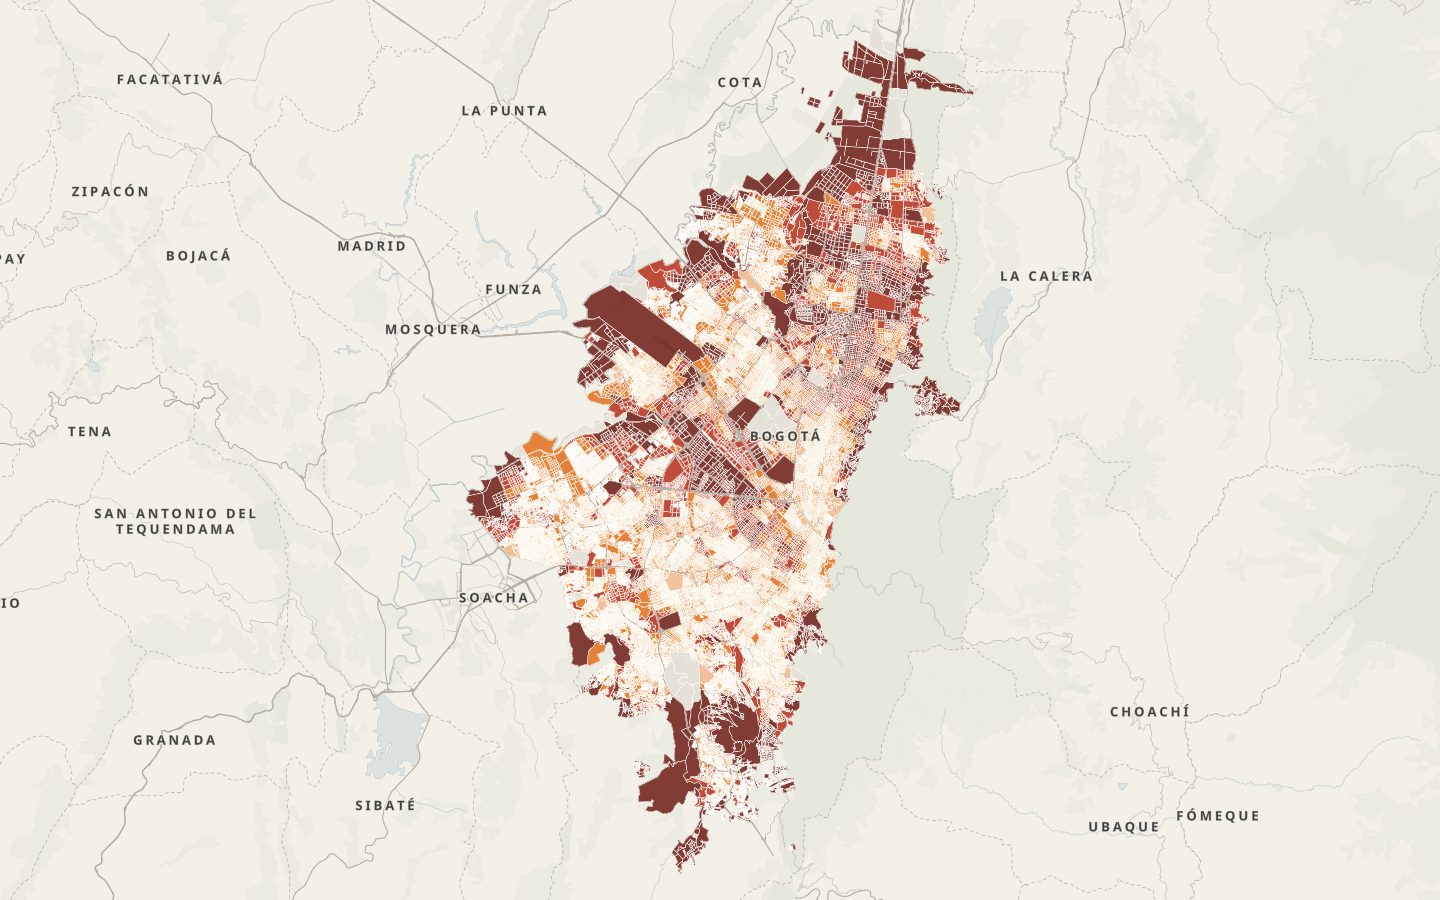
Across UPLs, average height and vacant housing correlate at 0.70; height and the proximity index, at −0.45. The high-rise north and the center have the most vacant housing in the city.
The denominator rules
Per resident, the UPLs of the center and the ring have many times the pedestrian collisions of the periphery, but they receive many people who do not live there; fast roads are also concentrated in the center and the ring.
Working-class centers are in the periphery
Edén and Patio Bonito have most of their population in cells with a concentration of retail or services; Arborizadora, Lucero and Tintal, practically none.
See it on the map
What we recommend
Use the UPL rather than the locality to allocate investment: public health care and culture in the high-rise, low-proximity north (Usaquén, Britalia and Niza) and support for the working-class centers of the dense periphery.
Bogotá does not split into clear-cut pieces; comparing by UPL reveals differences that the locality hides.
Profile sheet of 34 indicators by UPL and locality, standard profiles and stability test · Bogotá, Colombia · 2026
Facing a similar problem?
We can run this analysis for your city, with your data and your question.
Relevant for
- Planning institutes and departments
- Municipal governments and councils
- Developers and real estate funds
- Firms that prepare plans